


Physical health

Physical health is a basic building block for children’s current wellbeing and future life outcomes. Being physically healthy includes being physically active, having a good diet and being in the healthy weight range.
Last updated February 2022
Some data is available on whether WA children aged 0 to 5 years are physically healthy.
Overview
This indicator considers some key measures of physical health for children including physical activity, screen time, diet, weight and long-term health issues.
Physical health is influenced by a range of factors including genetic, social and environmental influences. Research has found that Australian children living in areas with a high risk of social exclusion1 have, on average, worse health outcomes than children living in other areas.2 In particular, socioeconomic indicators such as having higher income and education levels are directly linked to better health outcomes.3
Limited regularly collected data exists on the physical health of WA children aged 0 to five years.
Three-quarters (76.7%) of Kindergarten students are in the healthy weight range.
Proportion of Kindergarten children in Body Mass Index (BMI)* categories, per cent, metropolitan Perth, 2018 and 2020
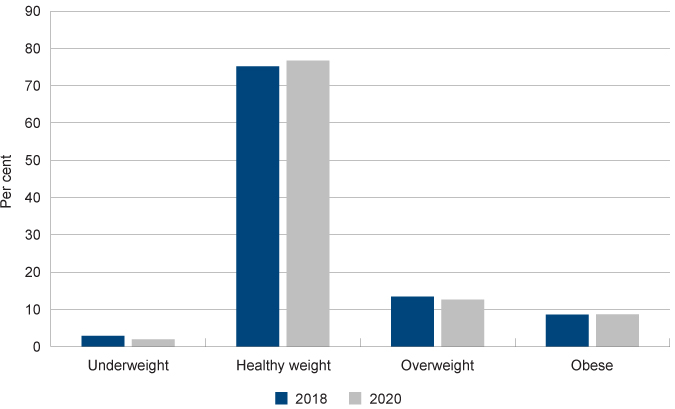
Data source: Custom reports provided by the WA Department of Health from the Child Development Information System (CDIS) from the School Entry Health Assessment [unpublished]
* It should be noted that BMI is not a diagnostic tool - if a child or young person has a high BMI for their age and sex they should be referred to a health professional for further assessment.
Areas of concern
Research suggests that many WA children aged 0 to five years may not be meeting the recommended physical activity guidelines, although more robust and regularly reported data is required.
In 2019, only 31.9 per cent of WA children aged from two to less than five years met the daily electronic media guidelines of no more than one hour of screen time per day.
Under 10 per cent of WA children aged four to eight years are eating the recommended number of serves of vegetables per day and more than 30 per cent of WA children aged two to eight years are likely consuming sugar-sweetened drinks (not including fruit juice).
Other measures
Oral health is also an important measure of child wellbeing, as oral disease can cause pain, discomfort, as well an increased risk of chronic disease in later life.4 While oral health is important for children and young people, it is not included in the Indicators of wellbeing.
The child health and development checks include an oral check and therefore are the primary mechanism for identifying issues with oral health. If children are attending the full complement of health checks (as reported in the Developmental screening indicator), oral health issues should be identified.
For more information about oral health in Australia refer to the Australian Institute of Health and Welfare’s Oral health and dental care in Australia web report.
Endnotes
- In this research social exclusion comprised five domains: socioeconomic circumstances, education, connectedness, housing and health service access.
- Australian Institute of Health and Welfare (AIHW) and National Centre for Social and Economic Modelling (NATSEM) 2014, Child social exclusion and health outcomes: A study of small areas across Australia, Bulletin 121, June 2014.
- World Health Organisation (WHO) 2008, The determinants of health, WHO.
- Australian Institute of Health and Welfare (AIHW) 2018, Oral health and dental care in Australia, AIHW.
Last updated February 2022
Physical activity makes an important positive contribution to the health and wellbeing of children. For children aged 0 to five years doing regular physical activity supports the development of healthy bones, muscles, joints, a healthy cardiovascular system and motor coordination. It is also an important element to achieving and maintaining a healthy weight.
Physical activity also enhances cognitive functioning including memory, concentration and the ability to learn.1 Furthermore, it is associated with social and emotional benefits including self-regulation and self-esteem.2
The current recommendations for physical activity every day for children aged 0 to five years are as follows:3
|
Under 1 year |
1 to 2 years |
3 to 5 years |
|
|
Physical activity |
Multiple times a day |
3 hours |
3 hours |
|
Specific recommendations |
30 minutes tummy time |
Variety of activities including energetic play |
At least 1 hour of energetic play |
Source: Physical activity and exercise guidelines for all Australians
Measuring the physical activity of very young children is difficult. It generally relies on parent-reported data collected from interviews or surveys (such as the WA Health and Wellbeing Surveillance system).
Research shows that while parent-reported data on physical activity for children under 12 years of age is valid, it has limitations depending on the questions asked (e.g. difficulty estimating unstructured play).4 In recent years more researchers are using devices such as accelerometers and other technology to gather more ‘objective’ data.5
There is limited recent data on the physical activity of 0 to five year-old WA children.
The WA Department of Health administers the WA Health and Wellbeing Surveillance system, which includes interviewing WA parents and carers with children aged 0 to 15 years.6 In this survey parents and carers are asked about their children’s activity levels and based on these responses the Department of Health determine the proportion of WA children meeting the physical activity guidelines. The survey questions for physical activity are only reported for children aged five to nine and 10 to 15 years, therefore there is no publicly reported data for children under five years of age.
The Australian Bureau of Statistics 2011–12 National Nutrition and Physical Activity Survey (NNPAS) included data on the physical activity of children aged two to four years. This was based on an interview with an adult about one child (aged two years and over) in the household.
Only the total average time spent on physical activity was reported for WA and other jurisdictions.
|
Per week day |
Per weekend day |
Per day |
|
|
WA |
357 |
389 |
366 |
|
NSW |
362 |
377 |
363 |
|
VIC |
339 |
352 |
345 |
|
QLD |
401 |
428 |
408 |
|
SA |
384 |
385 |
383 |
|
TAS |
369 |
365 |
370 |
|
NT |
435 |
443 |
434 |
|
ACT |
365 |
348 |
359 |
|
Australia |
367 |
384 |
371 |
Source: Australian Bureau of Statistics 43640 Australian Health Survey - National Nutrition and Physical Activity Survey (NNPAS) 2011-12 – Table 22.1
Average time children aged 2 to 4 years spent on physical activity, minutes, WA and other jurisdictions, 2011–12
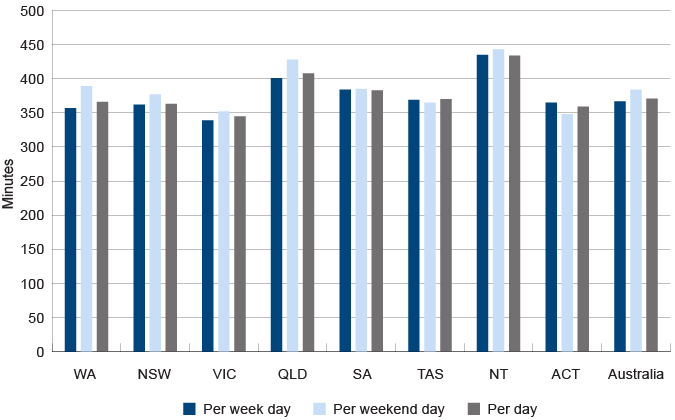
Source: Australian Bureau of Statistics 43640 Australian Health Survey - National Nutrition and Physical Activity Survey (NNPAS) 2011–12 – Table 22.1
This survey found that Australian two to four year-olds spent an average of six hours and 12 minutes (372 minutes) per day engaged in physical activity with just under half (47%) of the physical activity coming from outside activities. WA children aged two to four years spent an average of 366 minutes per day engaged in physical activity, slightly less than the national average.
While most Australian two to four year-olds (84%) averaged three or more hours of physical activity per day, just under three-quarters (72%) were physically active for three hours or more per day on all seven days prior to the ABS survey, meeting the physical activity recommendation.7
This survey is not currently planned to be repeated.
The Australian Bureau of Statistics also conducts the Childhood Education and Care survey which captures data on parents’ participation in informal learning for 0 to two year-olds and three to eight year-olds. This includes parental involvement in physical activities with their children.
|
2011 |
2014 |
2017 |
||
|
0 to 2 years |
WA |
62.3 |
68.3 |
64.7 |
|
Australia |
65.9 |
61.7 |
68.2 |
|
|
3 to 8 years |
WA |
87.0 |
89.0 |
85.6 |
|
Australia |
82.2 |
82.1 |
85.2 |
|
Source: Australian Bureau of Statistics 2018, Childhood Education and Care, Australia, June 2014 and 2017, cat no. 4402.0, Western Australian and Australian Tables 19 and 20 Parental involvement in informal learning and Australian Bureau of Statistics custom report, June 2011 [unpublished]
Proportion of children with parental involvement in physical activities last week by age group, per cent, WA and Australia, 2011, 2014 and 2017
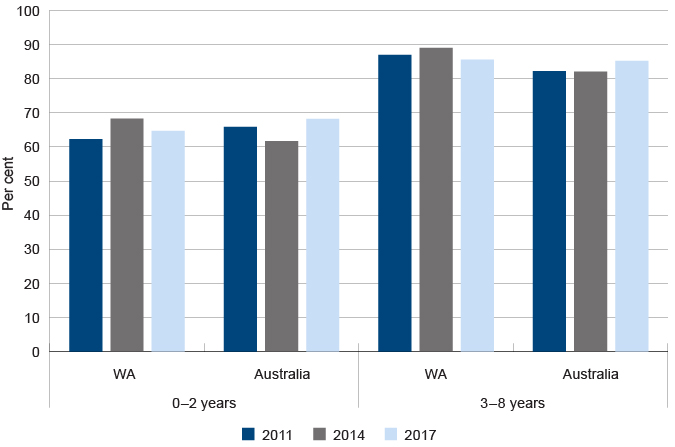
Source: Australian Bureau of Statistics 2018, Childhood Education and Care, Australia, June 2014 and 2017, cat no. 4402.0, Western Australian and Australian Tables 19 and 20 Parental involvement in informal learning and Australian Bureau of Statistics custom report, June 2011 [unpublished]
Parents of WA children aged three to eight commonly engaged in sport or outdoor games (85.6%). Compared nationally, the proportions were largely similar in 2017, although WA parents of 0 to two year-olds were somewhat less likely to engage in physical activities (64.7% compared to 68.2%).
This survey does not report the number of hours of physical activity for WA children.
From 2015 to 2018 the University of WA conducted the Play Spaces and Environments for Children’s Physical Activity and Health (PLAYCE) study to report on how physically active WA pre-schoolers are on average. In total, 104 Early Childhood Education and Care (ECEC) services and 1,596 children and their families in the Perth metropolitan area took part in this study.8
Physical activity was measured using accelerometers worn by children over seven days. They found that only 34 per cent of children aged two to five years met the recommended 180 minutes of physical activity per day.9 This contrasts with the 2011–2012 NNPAS survey which reported that the majority (72%) of children met the recommended guidelines.
The PLAYCE study also found a significant gender gap, with only 12 per cent of female toddlers (two to less than three years) and 29 per cent of female pre-schoolers (three to five years) meeting the guidelines, compared to 25 per cent of male toddlers and 55 per cent of male pre-schoolers.10
A key goal of the PLAYCE study was to understand how physically active children are when at ECEC services. They concluded that based on an average eight-hour day at ECEC, less than 12 per cent of children aged two to five years met the recommended three hours of physical activity per day.11
The results from these studies suggest that many WA children aged 0 to five years may not be meeting the recommended physical activity guidelines, although more regularly reported data is required. There is also a clear gender gap in this age group where young girls are more likely to not meet the recommended activity levels.
There is limited regularly reported data on the physical activity of WA Aboriginal children or children in metropolitan, regional and remote locations. The WA Health and Wellbeing Surveillance System does not provide disaggregated information on physical activity for Aboriginal children or by geographic location.
In 2012–13, the Australian Bureau of Statistics conducted the Australian Aboriginal and Torres Strait Islander Health Survey: Physical activity to collect data on the physical activity of Aboriginal children across Australia. This data was not disaggregated by state. They found that 45.6 per cent of WA Aboriginal children and young people aged five to 17 years in non-remote areas met the physical activity recommendation compared with only 40.5 per cent of WA non-Aboriginal children and young people.12
In remote areas across Australia,13 just over four in five (86%) Aboriginal children aged five to eight years and an equivalent proportion of nine to 11 year-olds (87%) did more than 60 minutes of physical activity on the day prior to the interview.14
There is no data on physical activity of WA children under five years of age by regional location or Aboriginal status.
Endnotes
- WA Department of Sport and Recreation 2015, Brain Boost: how sport and physical activity enhance children’s learning, Centre for Sport and Recreation Research, Curtin University.
- Australian Institute of Health and Welfare (AIHW) 2018, Physical activity across the life stages, Cat No PHE 225, AIHW.
- Department of Health, The Australia’s Physical Activity and Sedentary Behaviour Guidelines for Children (5 – 12 years), Australian Government.
- Bauman A et al 2019, Physical activity measures for children and adolescents - recommendations on population surveillance: an Evidence Check rapid review, Sax Institute, p. 14.
- Sylvia LG et a 2013, Practical guide to measuring physical activity, Journal of the Academy of Nutrition and Dietetics, Vol 114, No 2.
- The WA Department of Health’s, Health and Wellbeing Surveillance System is a continuous data collection which was initiated in 2002 to monitor the health status of the general population. In 2019, over 546 parents/carers of children aged 0 to 15 years were randomly sampled and completed a computer assisted telephone interview between January and December, reflecting an average participation rate of just over 90 per cent. The sample was then weighted to reflect the WA child population.
- Australian Bureau of Statistics 2013, 4364.0.55.004 - Australian Health Survey: Physical Activity, 2011–12 – Summary of Children aged 2–4 years, ABS.
- Christian H et al 2018, A snapshot of the PLAYCE project: Findings from the Western Australian PLAY Spaces and Environments for Children’s Physical Activity Study, Supportive Childcare Environments for Physical Activity in the Early Years, The University of WA, School of Population and Global Health.
- Ibid, p. 7.
- Ibid, p. 7.
- Ibid, p. 9.
- Australian Bureau of Statistics, 4727.0.55.004 - Australian Aboriginal and Torres Strait Islander Health Survey: Physical activity, 2012–13, Table 9.3 Whether met physical and screen-based activity recommendations by Indigenous status by selected characteristics, Children aged 5–17 years in non-remote areas (proportion).
- Australian Bureau of Statistics note that testing indicated that the way the guidelines had been developed into a survey instrument for use in non-remote areas did not work well in more remote areas of Australia. As a result, in remote areas, minimal data was collected only for the day prior to the interview for a range of physical activities, with no measurement of the intensity of these activities.
- Australian Bureau of Statistics, 4727.0.55.004 - Australian Aboriginal and Torres Strait Islander Health Survey: Physical activity, 2012–13, Remote areas (5 years and over), Table 18.3 Physical activity and sedentary behaviour by age then sex, Aboriginal and Torres Strait Islander children aged 5–17 years in remote areas (proportion).
Last updated February 2022
Over the past decade, it has been increasingly recognised that while media devices provide significant opportunities for learning and development, high levels of screen‑based activities can be detrimental to children’s health and wellbeing.1 A high level of screen time is associated with sedentary behaviour, low quality sleep and obesity.2,3
The Physical activity and exercise guidelines for all Australians provides recommendations on sedentary behaviour including screen time. Screen time is not recommended for children under two years of age and no more than one hour of screen time is recommended for children between two and five years of age.
The guidelines are principally focused on reducing sedentary behaviour – based on the theory that more hours spent viewing a screen means less physical exercise. Although it should be noted that screen time does not report on overall levels of sedentary behaviour, which can include other activities such as reading, sitting or lying down.4
Children now grow up with screens as an integral part of their everyday life and social development, and as more children have access to mobile devices it is increasingly difficult to measure daily screen time.
Due to this shift, it is more critical to focus on the quality of the content being consumed rather than a simple focus on the number of hours of screen time, particularly as children age.
While the screen time guidelines are specifically related to non-educational entertainment, estimates of children’s screen time will often include some educational activities.5 Therefore, the data may overestimate the amount of non-educational screen time.
The WA Department of Health administers the WA Health and Wellbeing Surveillance system, interviewing WA parents and carers with children aged 0 to 15 years.6 In this survey parents and carers are asked about how many hours per week their child spends watching television or using electronic devices and the like, and based on these responses the Department of Health determines the proportion of WA children meeting the sedentary behaviour guidelines.
|
0 to < 2 years |
2 to < 5 years |
|||
|
Meets guidelines |
Does not meet guidelines |
Meets guidelines |
Does not meet guidelines |
|
|
2012 |
49.4 |
50.6 |
28.3 |
71.7 |
|
2013 |
76.3 |
23.7* |
25.5 |
74.5 |
|
2014 |
58.8 |
41.2* |
36.4 |
63.6 |
|
2015 |
65.2 |
34.8 |
32.2 |
67.8 |
|
2016 |
50.4 |
49.6 |
30.1 |
69.9 |
|
2017 |
63.8 |
36.2* |
24.8* |
75.2 |
|
2018 |
62.9 |
37.1* |
25.8* |
74.2 |
|
2019 |
n/a |
n/a |
31.9* |
68.1 |
Source: Dombrovskaya M et al 2020, Health and Wellbeing of Children in Western Australia in 2019, Overview and Trends, Department of Health, Western Australia (and previous years’ reports)7
* Prevalence estimate has a relative standard error between 25 per cent and 50 per cent and should be used with caution.
N/A Prevalence estimate has an RSE greater than 50 per cent and is considered too unreliable for general use.
In 2019, less than one-third (31.9%) of children aged between two and five years were reported as meeting the electronic media use guidelines.
Although there was no comparative data in 2019, over the previous years children aged between two and five years were significantly less likely to meet the daily screen usage guidelines compared with children aged less than two years (25.8% compared to 62.9% in 2018). The number of children meeting the guidelines increased again in the five to 15 year age group (80.7% in 2018).8
The Australian Bureau of Statistics conducted the 2011–12 National Nutrition and Physical Activity Survey (NNPAS) throughout Australia from May 2011 to June 2012. NNPAS was collected as one of a suite of surveys conducted from 2011–2013, called the Australian Health Survey (AHS). This captures information on physical activity and sedentary behaviour of Australian children across jurisdictions.
In 2011–12, only 26 per cent of Australian children aged two to four years met the screen-based recommendations on all seven days prior to this survey.9 This is consistent with the results from the WA Health and wellbeing surveillance system.
Longitudinal research using data from the Longitudinal Study of Australian Children data found that 44 per cent of Australian children aged four to five years are spending more than the two hours a day on screen-based activities,10 which is more than double the recommended screen time for this age group. The same research suggests that older children who enjoy doing physical activities will spend less time in front of screens.11 This highlights the importance of engaging young children in fun physical activities to provide the foundation for a more active childhood.
Endnotes
- Yu M and Baxter J 2016, Australian children’s screen time and participation in extracurricular activities, in The Longitudinal Study of Australian Children Annual Statistical Report 2015, Australian Institute of Family Studies.
- Laurson KR et al 2014, Concurrent associations between physical activity, screen time, and sleep duration with childhood obesity, International Scholarly Research Notices: Obesity, Vol 2014.
- Fuller C et al 2017, Bedtime Use of Technology and Associated Sleep Problems in Children, Global Pediatric Health, Vol 4.
- WA Department of Health 2019, Sedentary behaviour, WA Government, [website].
- Yu M and Baxter J 2016, Australian children’s screen time and participation in extracurricular activities, in The Longitudinal Study of Australian Children Annual Statistical Report 2015, Australian Institute of Family Studies.
- The WA Department of Health’s, Health and Wellbeing Surveillance System is a continuous data collection which was initiated in 2002 to monitor the health status of the general population. In 2019, 546 parents/carers of children aged 0 to 15 years were randomly sampled and completed a computer assisted telephone interview between January and December, reflecting an average participation rate of just over 90 per cent. The sample was then weighted to reflect the WA child population.
- This data has been sourced from individual annual Health and Wellbeing Surveillance System reports and therefore has not been adjusted for changes in the age and sex structure of the population across these years nor any change in the way the question was asked. No modelling or analysis has been carried out to determine if there is a trend component to the data, therefore any observations made are only descriptive and are not statistical inferences.
- Patterson C et al 2019, Health and Wellbeing of Children in Western Australia in 2018, Overview and Trends, Department of Health, Western Australia.
- Australian Bureau of Statistics 43640 Australian Health Survey - National Nutrition and Physical Activity Survey (NNPAS) 2011–12 – Table 3.1 Summary activity indicators by sex, Children aged 2–4 years.
- Yu M and Baxter J 2016, Australian children’s screen time and participation in extracurricular activities, in The Longitudinal Study of Australian Children Annual Statistical Report 2015, Australian Institute of Family Studies, p. 102.
- Ibid, p. 119–120.
Last updated February 2022
Diet has a strong influence on wellbeing from birth. Children need to have a nutritious and balanced diet to grow and develop in a healthy way and to reduce the risk of developing chronic diseases later in life.
Research has shown that eating a wide variety of nutritious foods and limiting consumption of fatty and sugary foods is critical to healthy development and growth.1
The Australian government publishes the Australian Dietary Guidelines to provide guidance on foods, food groups and dietary patterns that protect against chronic disease and provide the nutrients required for optimal health and wellbeing. The guidelines are:
- To achieve and maintain a healthy weight, be physically active and choose amounts of nutritious food and drinks to meet your energy needs.
- Enjoy a wide variety of nutritious foods from the five food groups every day.
- Limit intake of foods containing saturated fat, added salt, added sugars and alcohol.
- Encourage, support and promote breastfeeding.
- Care for your food; prepare and store it safely.
A key component of the guidelines are the recommended daily serves of fruit and vegetables.
|
2 to 3 years |
4 to 8 years |
|
|
Minimum recommended number of serves of vegetables and legumes/beans per day |
||
|
Boys |
2.5 |
4.5 |
|
Girls |
2.5 |
4.5 |
|
Minimum recommended number of serves of fruit per day |
||
|
Boys |
1 |
1.5 |
|
Girls |
1 |
1.5 |
Source: National Health and Medical Research Council 2013, Australian Dietary Guidelines, p. 42
The guidelines for fruit and vegetable consumption were revised by the National Health and Medical Research Council (NHMRC) in 2013.
In the 2017–18 National Health Survey, the Australian Bureau of Statistics asked parents/carers about their children’s fruit and vegetable consumption. In this survey, a very low proportion of Australian children were eating the recommended number of serves of vegetables (18.5% of 2 to 3 year-olds, 3.8% of 4 to 8 year-olds).
|
2 to 3 years |
4 to 8 years |
|
|
Consuming recommended serves of fruit |
97.4 |
77.8 |
|
Consuming recommended serves of vegetables |
18.5 |
3.8 |
Source: ABS, National Health Survey 2017-18, Table 17.3 Children's consumption of fruit, vegetables, and selected sugar sweetened and diet drinks
The WA Department of Health administers the WA Health and Wellbeing Surveillance system, which includes interviewing WA parents and carers with children aged 0 to 15 years.2 In this survey, parents and carers are asked about their children’s diet and based on these responses the Department of Health determine the proportion of WA children meeting the healthy eating guidelines.
A very high proportion of young children in WA are meeting the guidelines for fruit consumption, however a much lower proportion of young children are eating enough vegetables on a daily basis.
In 2019, only 7.8 per cent of WA children aged four to eight years were eating the recommended quantity of vegetables.
|
Consuming recommended |
Consuming recommended |
|||
|
2 to 3 years |
4 to 8 years |
2 to 3 years |
4 to 8 years |
|
|
2014 |
98.2 |
97.3 |
63.2 |
11.7 |
|
2015 |
98.7 |
99.2 |
56.8 |
24.5 |
|
2016 |
96.0 |
97.8 |
45.2 |
12.4 |
|
2017 |
99.1 |
98.5 |
41.6 |
7.4* |
|
2018 |
97.7 |
96.3 |
65.8 |
17.1 |
|
2019 |
95.8 |
96.0 |
60.7 |
7.8 |
Source: Dombrovskaya M et al 2020, Health and Wellbeing of Children in Western Australia in 2019, Overview and Trends, Department of Health, Western Australia (and previous years’ reports) 3
* Prevalence estimate has a relative standard error between 25 per cent and 50 per cent and should be used with caution.
Note: As the consumption of half serves is not captured in the questions currently asked in the WA Health survey, for the purposes of reporting, the recommended number of serves is rounded down to the nearest whole number.
Subject to the margin of error, in 2019 approximately 37.6 per cent of WA children aged two to three years are only eating one serve of vegetables on a daily basis.
|
1 serve |
2 serves |
3 serves |
4 serves or more |
|
|
2014 |
28.7 |
29.0 |
21.5* |
12.8* |
|
2015 |
41.4 |
33.4 |
12.3* |
11.2* |
|
2016 |
50.7 |
35.2 |
7.5* |
2.6* |
|
2017 |
53.9 |
20.4* |
20.4* |
n/a |
|
2018 |
29.4* |
50.1 |
9.7 |
n/a |
|
2019 |
37.6* |
31.9 |
n/a |
n/a |
Source: Dombrovskaya M et al 2020, Health and Wellbeing of Children in Western Australia in 2019, Overview and Trends, Department of Health, Western Australia (and previous years’ reports) 4
* Prevalence estimate has a relative standard error between 25 per cent and 50 per cent and should be used with caution.
n/a - Prevalence estimate has a RSE greater than 50 per cent and is considered too unreliable for general use.
In 2019, parent/carer responses suggest that less than 10 per cent of WA children aged four to eight years are meeting the recommended guidelines of four and one-half serves of vegetables per day.
|
Less than 1 serve |
1 serve |
2 serves |
3 serves |
4 serves or more |
|
|
2014 |
n/a |
28.1 |
40.0 |
16.4 |
11.7 |
|
2015 |
4.7* |
22.3 |
31.5 |
17.1 |
24.5 |
|
2016 |
9.0* |
25.5 |
37.1 |
15.9 |
12.4 |
|
2017 |
3.6* |
35.6 |
32.3 |
21.1 |
7.4* |
|
2018 |
n/a |
27.5 |
38.3 |
17.0 |
17.1 |
|
2019 |
n/a |
30.0 |
34.7 |
20.8* |
7.8* |
Source: Dombrovskaya M et al 2020, Health and Wellbeing of Children in Western Australia in 2019, Overview and Trends, Department of Health, Western Australia (and previous years’ reports) 5
* Prevalence estimate has a relative standard error between 25 per cent and 50 per cent and should be used with caution.
n/a - Prevalence estimate has a RSE greater than 50 per cent and is considered too unreliable for general use.
This data suggests that there has been little or no improvement in the proportion of young children eating a sufficient amount of vegetables over the past six years.
The 2018–19 National Aboriginal and Torres Strait Islander Health Survey collected data on Aboriginal children’s diet. Similar to non-Aboriginal children a large majority of Aboriginal children are eating sufficient fruits, but most are not eating sufficient vegetables.
|
2 to 3 years |
4 to 8 years |
|
|
Consuming recommended serves of fruit |
92.4 |
69.6 |
|
Consuming recommended serves of vegetables |
23.4 |
2.4 |
Source: ABS, National Aboriginal and Torres Strait Islander Health Survey, Australia, 2018–19, Table 17.3 Selected dietary indicators, by age, sex and remoteness, Aboriginal and Torres Strait Islander children aged 2–17 years
Refer to the following resource for a more detailed discussion on nutrition among Aboriginal communities:
Lee A and Ride K 2018, Review of nutrition among Aboriginal and Torres Strait Islander people, Australian Indigenous HealthInfoNet.
Guideline three of the Australian Dietary Guidelines also recommends that adults and children should limit intake of foods and drinks containing saturated fats and added sugars such as biscuits, cakes, confectionary, sugar-sweetened soft drinks and cordials, fruit drinks and sports drinks.6
Reducing young children’s sugar consumption has been highlighted as particularly critical. Sugar consumption in childhood is directly linked to overweight and obesity, and dental health conditions, both of which impact lifelong health.7 There is also strong evidence to suggest that foods and drinks consumed by children early in life establish their preferences for tastes (e.g. sweetness) later in life.8
The Australian Infant Feeding Guidelines recommend that sugar (including honey) should not be added to an infant’s food and as children age they should avoid juices and sweetened drinks.9 Yet Australian research has found that one in five infants had consumed food or drink containing sugars by the time they were six to nine months. This study also reported that children born to mothers experiencing socio-economic disadvantage were more likely to be introduced early to foods and drinks containing sugar.10
Unlike serves of fruit and vegetables, the consumption of sugar is more complex to measure as sugar occurs naturally in many foods. The World Health Organization recommends reducing the intake of free sugars to less than 10 per cent of total energy intake in both adults and children.11
Australian recommendations are focused on reducing consumption of foods with added sugar including biscuits, cakes, soft drinks, cordial, fruit juice etc.
The ABS National Health Survey collects data on children’s consumption of sugar-sweetened drinks.
This survey shows that more than 30 per cent of WA children aged two to eight years are likely consuming sugar-sweetened drinks (not including fruit juice).
|
2 to 3 years |
4 to 8 years |
|
|
WA |
67.7* |
67.6 |
|
Australia |
81.8 |
69.4 |
Source: Australian Bureau of Statistics, National Health Survey, First Results 2017–18 – Australia and Western Australia, Table 17.3 Children's consumption of fruit, vegetables, and selected sugar sweetened and diet drinks
* Proportion has a high margin of error and should be used with caution.
Note: Sugar-sweetened drinks includes soft drink, cordials, sports drinks or caffeinated energy drinks. May include soft drinks in ready to drink alcoholic beverages. Excludes fruit juice, flavoured milk, 'sugar free' drinks, or coffee / hot tea.
The 2017–18 survey reports that 67.6 per cent of WA children aged four to eight years do not consume any sugar-sweetened drinks on a daily basis. Approximately 67.7 per cent of two to three-year-olds in WA are estimated to not consume any sugar-sweetened drinks on a daily basis.12 However, this proportion should be considered with caution as it has a high margin of error. These proportions are relatively consistent with the Australia-wide results.
Endnotes
- National Health and Medical Research Council 2013, Australian Dietary Guidelines: Providing the scientific evidence for healthier Australian diets, National Health and Medical Research Council.
- The WA Department of Health’s, Health and Wellbeing Surveillance System is a continuous data collection which was initiated in 2002 to monitor the health status of the general population. In 2019, over 546 parents/carers of children aged 0 to 15 years were randomly sampled and completed a computer assisted telephone interview between January and December, reflecting an average participation rate of just over 90 per cent. The sample was then weighted to reflect the WA child population.
- This data has been sourced from individual annual Health and Wellbeing Surveillance System reports and therefore has not been adjusted for changes in the age and sex structure of the population across these years nor any change in the way the question was asked. No modelling or analysis has been carried out to determine if there is a trend component to the data, therefore any observations made are only descriptive and are not statistical inferences.
- Ibid.
- Ibid.
- National Health and Medical Research Council 2013, Australian Dietary Guidelines: Providing the scientific evidence for healthier Australian diets, National Health and Medical Research Council.
- Diep H et al 2017, Factors influencing early feeding of foods and drinks containing free sugars—a birth cohort study, International Journal of Environmental Research and Public Health, Vol 14 No 10.
- Ibid.
- National Health and Medical Research Council 2013, Australian Infant Feeding Guidelines, National Health and Medical Research Council.
- Diep H et al 2017, Factors influencing early feeding of foods and drinks containing free sugars—a birth cohort study, International Journal of Environmental Research and Public Health, Vol 14 No 10.
- World Health Organization (WHO) 2015, Guideline: Sugars intake for adults and children, WHO. Free sugars include monosaccharides and disaccharides added to foods and beverages by the manufacturer, cook or consumer, and sugars naturally present in honey, syrups, fruit juices and fruit juice concentrates.
- Ibid.
Last updated February 2022
Being overweight or obese in childhood increases the likelihood of poor physical health in both the short and long term. Being obese increases a child’s risk of a range of conditions such as asthma, Type 2 diabetes and cardiovascular conditions.1 In recent years more children are being diagnosed with Type 2 diabetes, when it was previously considered a disease of adulthood.2
Children who are overweight or obese are more likely to be overweight or obese in adulthood.3 Overweight or obese children who continue to be overweight or obese in adulthood face a higher risk of developing coronary heart disease, diabetes, certain cancers, gallbladder disease, osteoarthritis and endocrine disorders.4
Obesity in children is also associated with a number of psychosocial problems, including social isolation, discrimination and low self-esteem.5
The data item for this measure is the Body Mass Index (BMI), which is a common measure of assessing whether a person is at risk of being overweight or obese. The BMI is calculated by dividing weight in kilograms by the square of height in metres. BMI scores take into account the age and sex of the child, however, it is not recommended for children up to two years.6
The use of BMI to measure healthy weight is contested, particularly as it does not distinguish between fat and muscle or the location of the fat.7 BMI is not a diagnostic tool. If a child or young person has a high BMI for their age and sex they should be referred to a health professional for further assessment considering physical activity and diet, and using other measures such as skin fold thickness or dual energy X-ray absorptiometry (DEXA).8,9,10 BMI is, however, considered an appropriate tool for population-level measurement and trend analysis.11
Data is collected on the BMI of children entering Kindergarten and Pre-primary as part of the School Entry Health Assessment. In 2020, 24,494 children enrolled in Kindergarten in metropolitan Perth had a valid height and weight measurement through the School Entry Health Assessment.
|
2018 |
2020 |
|||
|
Number assessed |
Per cent |
Number assessed |
Per cent |
|
|
Underweight |
691 |
2.9 |
489 |
2.0 |
|
Healthy weight |
17,993 |
75.2 |
18,781 |
76.7 |
|
Overweight |
3,198 |
13.4 |
3,097 |
12.6 |
|
Obese |
2,059 |
8.6 |
2,127 |
8.7 |
|
Total |
23,941 |
24,494 |
||
Data source: Custom reports provided by the WA Department of Health from the Child Development Information System (CDIS) from the School Entry Health Assessment [unpublished]
Notes: BMI percentile for age and BMI category is calculated using the Centers for Disease Control and Prevention BMI Percentile Calculator. Children may complete additional assessments where issues are identified for follow up. For children with multiple height and weight measures, the first measurement only has been included.
Proportion of Kindergarten children by Body Mass Index (BMI) categories, per cent, metropolitan Perth, 2018 and 2020
Data source: Custom report provided by the WA Department of Health from the Child Development Information System (CDIS) from the School Entry Health Assessment [unpublished]
Prior to 2018, height and weight were not universally measured and therefore may not provide accurate estimates of population prevalence and are not reported.
In 2020, just over three-quarters (76.7%) of Kindergarten students in the Perth metropolitan area were in the healthy weight range, while 21.3 per cent were in the overweight or obese categories.
Similarly, over three-quarters (78.2%) of Kindergarten students in regional and remote WA were in the healthy weight range, while 19.1 per cent were in the overweight or obese categories.
|
Number assessed |
Per cent |
|
|
Underweight (BMI percentile <5%) |
143 |
2.7 |
|
Healthy weight (BMI percentile 5% - <85%) |
4,081 |
78.2 |
|
Overweight (BMI percentile 85% - <95%) |
599 |
11.5 |
|
Obese (BMI percentile ≥95%) |
398 |
7.6 |
|
Total |
5,221 |
Source: Custom report provided by the WA Country Health Service to the Commissioner for Children and Young People [unpublished]
Note: The WA Country Health Service (WACHS) was unable to provide BMI data from School Entry Health Assessments conducted prior to 2020 as the data was not collected in a single system.
The Australian Bureau of Statistics National Health Survey also collects data on rates of obesity or overweight for young children across Australia. Considering the age ranges, these results are relatively consistent with the School Entry Health Assessment BMI data.
|
2 to 4 years |
5 to 7 years |
|||||
|
2011–12 |
2014–15 |
2017–18 |
2011–12 |
2014–15 |
2017–18 |
|
|
Underweight |
4.8 |
6.1 |
8.5 |
4.7 |
6.9 |
7.5 |
|
Normal |
74.0 |
74.0 |
66.6 |
70.7 |
68.5 |
65.1 |
|
Overweight |
17.1 |
11.3 |
16.0 |
16.0 |
14.6 |
17.4 |
|
Obese |
4.1 |
8.7 |
9.2 |
8.7 |
10.0 |
10.3 |
|
Total |
100.0 |
100.0 |
100.0 |
100.0 |
100.0 |
100.0 |
Source: Australian Bureau of Statistics 2020, National Health Survey, Children’s body mass index tables
In 2017–18, 16.0 per cent of Australian children aged two to four years were categorised as overweight and 9.2 per cent as obese based on the BMI. A higher proportion of children were overweight or obese at age five to seven years (17.4% and 10.3% respectively). These results represent an increase in overweight and obesity compared to previous years.
There has also been increase in the proportion of young children who are underweight.
Proportion of children by Body Mass Index categories and age, per cent, Australia, 2011–12, 2014–15 and 2017–18
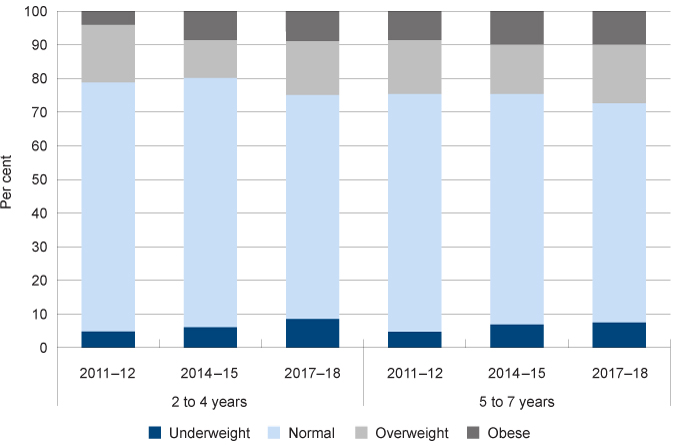
Source: Australian Bureau of Statistics 2020, National Health Survey, Children’s body mass index tables
The WA data for children in the National Health Survey has a very high margin of error and has not been reported here.
In 2017, AIHW presented a birth cohort analysis of prevalence of overweight and obesity for a particular group of people born in the same year. They noted that over a recent 20-year period (1995–2015) there has been no statistically significant increase in rates of obesity and overweight (combined) in children aged two to five years. However, the rate of obesity increased significantly with 8.8 per cent of children aged two to five years born in 2010–2013 categorised as obese, compared to 4.2 per cent of those born in 1990–1993. Thus, the proportion of children aged two to five who were overweight decreased in those 20 years.12
In 2012–13 the Australian Bureau of Statistics conducted the Australian Aboriginal and Torres Strait Islander Health Survey (AATSIHS). In this survey they measured the BMI of participating Aboriginal children and found that 15.8 per cent of two-to-four year-old Aboriginal children across Australia were overweight and 6.5 per cent were obese.13 Aboriginal children aged two to 14 years were more likely than non-Aboriginal children to be obese (8% compared to 5%) and less likely to be in the healthy weight range (62% compared to 70%).14
In 2018–19 the Australian Bureau of Statistics conducted the National Aboriginal and Torres Strait Islander Health Survey which provided data at the jurisdictional level. Results showed the proportion of overweight or obese WA children aged two to 17 to be 35.6 per cent. There was no comparative data for non-Aboriginal WA children in this survey.
There is no recent data on the BMI (or other measures of healthy weight) of WA Aboriginal children.
Aboriginal adults are also 1.6 times more likely to be obese than non-Aboriginal adults indicating increased risk of developing chronic disease.15 It is therefore critical to address overweight and obesity for Aboriginal children.
Children living in areas of greater socioeconomic disadvantage are also more likely to be overweight or obese. In 2017, a significantly higher proportion of children aged five to 15 years living in the most disadvantaged areas of WA were overweight or obese compared with children living in the least disadvantaged areas of WA (44.9% compared with 19.3%).16
Socioeconomic disadvantage influences children’s weight for multiple, intersecting reasons including limited access to affordable fresh fruit and vegetables and easy access to fast food, availability of primary health services and access to quality outdoor green spaces. Additionally, parents with a lower level of education often have less access to nutritional knowledge which also leads to less healthy dietary practices.17
Endnotes
- Australian Institute of Health and Welfare (AIHW) 2012, A picture of Australia’s children 2012, Cat No PHE 167, AIHW.
- Davis E 2018, Submission 33 to the Education and Health Standing Committee of the WA Parliament Inquiry: The role of diet in type 2 diabetes prevention and management, Perth Children’s Hospital.
- Venn AJ et al 2007, Overweight and obesity from childhood to adulthood: a follow-up of participants in the 1985 Australian Schools Health and Fitness Survey, The Medical Journal of Australia, Vol 186, No 9.
- Australian Institute of Health and Welfare (AIHW) 2012, A picture of Australia’s children 2012, Cat No PHE 167, AIHW.
- ARACY 2008, ARACY Report Card, Technical Report: The Wellbeing of Young Australians, ARACY.
- National Health and Medical Research Council 2013, Clinical practice guidelines for the management of overweight and obesity in adults, adolescents and children in Australia, Australian Government, p. 84.
- There is also increasing evidence to suggest that the type of fat is more important than overall weight – for example fat around the stomach has been shown to be more harmful than fat in other locations. Therefore some research has shown that someone with a relatively high BMI can be healthier than someone with a BMI in the ‘healthy’ range. Refer to Tomiyama et al 2016, Misclassification of cardiometabolic health when using body mass index categories in NHANES 2005–2012, The International Journal of Obesity, Vol 40, No 5.
- Centers for Disease Control and Prevention 2018, About Child and Teen BMI, National Center for Chronic Disease Prevention and Health Promotion [website].
- Nooyens AC 2007, Adolescent skinfold thickness is a better predictor of high body fatness in adults than is body mass index: the Amsterdam Growth and Health Longitudinal Study, The American Journal of Clinical Nutrition, Vol 85, No 6.
- Jensen NSO et al 2016, Review Paper: Comparison of methods to measure body fat in 7-to-10-year-old children: a systematic review, Public Health, Vol 133.
- Centers for Disease Control and Prevention 2018, Body Mass Index: Considerations for practitioners, Department of Health and Human Services USA.
- Australian Institute of Health and Welfare (AIHW) 2017, An interactive insight into overweight and obesity in Australia, AIHW.
- Australian Bureau of Statistics 2014, 4727.0 Australian Aboriginal and Torres Strait Islander Health Survey: First Results, 2012–13 — Australia, Table 24.3 Body Mass Index of Aboriginal and Torres Strait Islander children(a) by age and sex, Proportion of persons.
- Department of Prime Minister and Cabinet, Aboriginal and Torres Strait Islander, Health Performance Framework 2014 Report [website].
- Ibid.
- Merema M and Radomiljac A 2018, Health and Wellbeing of Children in Western Australia in 2017, Overview and Trends, WA Department of Health.
- NSW Council of Social Services (NCOSS) 2016, Overweight and Obesity: Balancing the scales for vulnerable children, NCOSS.
Last updated February 2022
The Australian Bureau of Statistics Disability, Ageing and Carers data collection reports that in 2018 approximately 9,000 WA children aged 0 to five years (4.4%) have reported disability1 and approximately 4,600 children are living with ‘profound or severe core activity limitation’ which indicates that a person is unable to do, or always needs help with, a core activity task.2
Male children aged 0 to five years are more likely to have a reported disability than female children of the same age (4.6% compared to 2.7%).3
The rate of reported disability increases with age, from 4.4 per cent of WA children aged 0 to five years to 11.5 per cent of those aged six to 11 years.4
The types of disability (disability group) that are reported and diagnosed also vary with age. This is in part because as children age, developmental difficulties in certain areas (such as intellectual capacity) become more apparent. Furthermore, there is a lack of formal intellectual testing in very young children.5
|
0 to 5 years |
6 to 11 years |
|
|
Sensory or speech |
69.9 |
38.4 |
|
Intellectual |
32.0 |
67.8 |
|
Physical restriction |
23.7 |
20.3 |
|
Psychosocial |
19.7 |
39.3 |
Source: Custom report provided to the Commissioner for Children and Young People WA by the Australian Bureau of Statistics based on the 2018 Disability, Ageing and Carers survey
Note: Children can have one or more types of disability.
Long term health conditions also have a significant impact on children with disability including impacting everyday activities. In 2018, three-quarters (74.0%) of Australian children aged 0 to 14 years with disability also reported a mental or behavioural disorder and 52.7 per cent reported a physical condition.6
The most commonly reported long-term health conditions for Australian children and young people with disability aged 0 to 14 years were autism and related disorders (26.8% of children and young people with disability in 2018), while asthma was also common (16.5%).7 The diagnosis of autism and related disorders in children with disability has increased since 2003 (2003: 6.2%, 2009: 13.0%, 2012: 19.9%, 2015: 24.4%, 2018: 26.8%).8
It should be noted that an increase in reported diagnoses over time, does not necessarily represent an increase in the proportion of children with a particular condition – the increase could be due to better diagnostic tools and/or greater community awareness leading to more assessments being carried out.
Approximately 5.0 per cent of WA children aged 0 to five years have a long-term health condition without disability.9
One preventable condition that impacts an unknown number of WA children is Fetal Alcohol Spectrum Disorders (FASD) which is a ‘hidden’ disability, and often confused with disobedience or conditions such as ADHD.10 FASD is an umbrella term which covers a range of possible birth defects and/or developmental disabilities that can be caused by exposure to alcohol prior to birth. It has a significant impact on mental health and increases the likelihood of social and emotional behavioural issues throughout life.11,12
The diagnosis of FASD is complex and until 2016 there was not a nationally adopted diagnostic tool for practitioners in Australia.13 As such, FASD is a condition that is under-recognised in Australia and often goes undiagnosed.14 In 2016, The Australian Guide to the diagnosis of Fetal Alcohol Spectrum Disorder (FASD) was released which provides health professionals with the tools necessary to diagnose FASD.15
It is generally recognised that many children and young people in out-of-home care and in contact with youth justice services are living with undetected FASD.16
Screening and assessment for FASD should occur as part of the universal child health checks and at key points across a child's life (e.g. Kindergarten, school entry), as well as when a child or young person enters the child protection or justice system. Any diagnosis needs to trigger appropriate referrals and be linked to clear supports and services, as without this, a diagnosis will have limited impact in terms of improving outcomes for children and young people.
Aboriginal children
There is limited robust data on the prevalence of disability among Aboriginal children. This is principally due to a lack of adequate sample size for Aboriginal populations in general surveys and these surveys are often not tailored to incorporate Aboriginal cultures and perspectives on health and wellbeing.17
Furthermore, Aboriginal children and young people can be more likely than non-Aboriginal children and young people to be under-diagnosed for disability or long-term health conditions.18,19,20
The Western Australian Aboriginal Child Health Survey (WAACHS) was a comprehensive cross-sectional study of the health and development of a representative random sample of 5,300 Aboriginal and Torres Strait Islander children and young people aged 0 to 17 years living in 2,000 families across WA, including remote areas. The study was conducted in 2000–2001 and has not been repeated.21
The WAACHS asked questions about restrictions to WA Aboriginal children and young people’s core activities that included self-care, mobility and communication.22 While the data is not recent and the authors recognised limitations, in general the findings in that study suggested that rates of disability among Aboriginal children were similar to those reported in the non-Aboriginal population.23
However, more recent data from the ABS 2015 Survey of Disability, Ageing and Carers reports that Aboriginal children and young people across Australia are more likely to experience disability than non-Aboriginal children and young people.
|
Total |
||
|
Aboriginal |
Non-Aboriginal |
|
|
Profound/severe core activity limitation |
5.9 |
3.9 |
|
Moderate/mild core activity limitation |
4.1 |
1.5 |
|
Schooling or employment restriction only |
2.1 |
0.9 |
|
All with specific restrictions |
11.0 |
6.3 |
|
Has disability but no specific restriction |
2.6 |
0.9 |
|
All with reported disability |
13.8 |
7.2 |
|
No reported disability |
86.8 |
92.9 |
|
Total |
100.0 |
100.0 |
Source: Australian Bureau of Statistics, 44300: Survey of Disability Ageing and Carers: Aboriginal and Torres Strait Islander People with Disability, 2015, Table 2.3 All persons living in households, Indigenous Status by Disability Status, Sex and Age – 2015
This data is not available for WA and there is no further breakdown by age group.
The 2018 Survey of Disability, Ageing and Carers did not provide data on Aboriginal children.
There are a range of intersecting social factors that may contribute to the potentially higher prevalence of disability in Aboriginal communities. These can include poverty, low birthweight, poor access to quality primary health care and high levels of alcohol consumption by some mothers during pregnancy.24
Furthermore, differences between Aboriginal and non-Aboriginal people’s conceptualisations of disability may impact identification, diagnosis and treatment. In addition, information may not be available in community languages, culturally appropriate services may not be available and Aboriginal families are more likely to mistrust government organisations due to the legacy of the stolen generations.25
Endnotes
- Data is sourced from a custom report provided to the Commissioner for Children and Young People WA by the Australian Bureau of Statistics based on the 2018 Disability, Ageing and Carers survey. The ABS uses the following definition of disability: ‘In the context of health experience, the International Classification of Functioning, Disability and Health (ICFDH) defines disability as an umbrella term for impairments, activity limitations and participation restrictions. In this survey, a person has a disability if they report they have a limitation, restriction or impairment, which has lasted, or is likely to last, for at least six months and restricts everyday activities’. Australian Bureau of Statistics 2019, Disability, Ageing and Carers, Australia, 2018, Glossary.
- This estimate should be used with caution as it has a relative standard error of between 25 and 50 per cent.
- Custom report provided to the Commissioner for Children and Young People WA by the Australian Bureau of Statistics based on the 2018 Disability, Ageing and Carers survey. The estimate for the proportion of female children with disability should be used with caution as it has a relative standard error of between 25 and 50 per cent.
- Custom report provided to the Commissioner for Children and Young People WA by the Australian Bureau of Statistics based on the 2018 Disability, Ageing and Carers survey.
- Australian Bureau of Statistics 2013, Australian Social Trends: 2012, Children with a disability, ABS catalogue no. 4102.0, Commonwealth of Australia, p. 3.
- Australian Bureau of Statistics 2020, Disability, Ageing and Carers, Australia: Summary of Findings, 2018: Children with Disability, ABS.
- Ibid.
- Australian Bureau of Statistics 2013, Australian Social Trends: 2012, Children with a disability, ABS catalogue no. 4102.0, Commonwealth of Australia, p. 3-4 and Australian Bureau of Statistics 2020, Disability, Ageing and Carers, Australia: Summary of Findings, 2018: Children with Disability, ABS.
- Custom report provided to the Commissioner for Children and Young People WA by the Australian Bureau of Statistics based on the 2018 Disability, Ageing and Carers survey.
- McLean S and McDougall S 2014, Fetal alcohol spectrum disorders: Current issues in awareness, prevention and intervention, CFCA Paper No 20, Child Family Community Australia (CFCA).
- Brown J et al 2018, Fetal Alcohol spectrum disorder (FASD): A beginner’s guide for mental health professionals, Journal of Neurological Clinical Neuroscience, Vol 2, No 1.
- Pei J et al 2011, Mental health issues in fetal alcohol spectrum disorder, Journal Of Mental Health, Vol 20, No 5, pp. 438–448.
- Bower C and Elliott EJ on behalf of the Steering Group 2016, Australian Guide to the diagnosis of Fetal Alcohol Spectrum Disorder (FASD), Telethon Kids Institute and University of Sydney, p. 4.
- Bower C and Elliott EJ on behalf of the Steering Group 2016, Australian Guide to the diagnosis of Fetal Alcohol Spectrum Disorder (FASD), Telethon Kids Institute and University of Sydney.
- Ibid.
- McLean S and McDougall S 2014, Fetal alcohol spectrum disorders: Current issues in awareness, prevention and intervention, CFCA Paper No 20, Child Family Community Australia (CFCA).
- Zubrick SR et al 2004, The Western Australian Aboriginal Child Health Survey: The Health of Aboriginal Children and Young People, Telethon Institute for Child Health Research, p.157.
- Bailey B and Arciuli J 2020, Indigenous Australians with autism: A scoping review, autism, Vol 24, No 5.
- Bower C et al 2018, Fetal alcohol spectrum disorder and youth justice: a prevalence study amount young people sentenced to detention in Western Australia, BMJ Open, Vol 8, No 2.
- Di Pietro N and Illes J 2016, Closing Gaps: Strength-Based Approaches to Research with Aboriginal Children with Neurodevelopmental Disorders, Neuroethics, Vol 9.
- Telethon uses the following definition of level of remote isolation (LORI) ‘LORI allows greater discrimination of the circumstances of survey respondents with respect to their isolation from population centres of various sizes and better differentiates between areas and communities that are extremely remote from major metropolitan centres’. Zubrick SR et al 2004, The Western Australian Aboriginal Child Health Survey: The Health of Aboriginal Children and Young People, Telethon Institute for Child Health Research, p.3.
- Ibid, p.157.
- Ibid, p.157.
- Department of Prime Minister and Cabinet 2014, Aboriginal and Torres Strait Islander: Health Performance Framework Report 2014, 1.14 Disability, Australian Government.
- DiGiacomo M et al 2013, Childhood disability in Aboriginal and Torres Strait Islander peoples: a literature review, International Journal for Equity in Health, Vol 12, No 7.
Last updated February 2022
At 30 June 2021 there were 1,536 WA children in care aged between 0 and five years, more than half of whom (61.3%) were Aboriginal.1
There is no publicly available data on the physical health of children in care aged 0 to 5 years in WA.
Children in care have a higher prevalence of chronic and complex physical, neurological and developmental conditions compared to children in the general population.2 It is therefore critical that children in the care of the state are provided with timely and comprehensive assessments of any health issues and services to meet those issues.
It is a requirement of the WA Department of Communities that children in care receive an initial medical examination within 20 days of entering care and then annual health assessments.3
In 2016, the WA Department for Child Protection (now Department of Communities) published the Outcomes Framework for Children in Out-of-Home Care 2015–16 Baseline Indicator Report. The outcomes framework identified two indicators related to reviewing the physical health of children in out-of-home care.
The first indicator was the ‘proportion of children who had an initial medical examination when entering out-of-home care’. In 2015, only 53.1 per cent of children entering out-of-home care had an initial medical examination.4
The second indicator was the ‘proportion of children who have had an annual health check of their physical development’. In this report the Department noted that there were limitations in data accuracy which prevented reporting on this indicator in 2015–16, however data would be reported in 2016–17.5 No data has been reported on this indicator as at publication date.
The lack of up to date data and the low proportion of children being provided with an initial medical examination in 2015–16 is inadequate; it is critical that children in the care of the state are provided with timely and comprehensive assessments of any health issues and services to meet those issues.
Endnotes
- Department of Communities 2021, Custom report provided by Department of Communities, WA Government [unpublished].
- Nathanson D and Tzioumi D 2007, Health needs of Australian children living in out of home care, Journal of Paediatric Child Health, Vol 43.
- Department of Child Protection and Family Support (Communities), Casework Practice Manual: Healthcare Planning, WA Government.
- Department for Child Protection and Family Support 2016, Outcomes Framework for Children in Out-of-Home Care 2015–16 Baseline Indicator Report, p. 5.
- Ibid, p. 10.
Last updated February 2022
Physical health is critical for children’s current wellbeing and also their future life outcomes. The physical health of children with disability is often viewed through the lens of their disability and other aspects of health can be overlooked.
There is a complex relationship between physical health and disability, however, adults with disability are more likely to have long-term chronic conditions including heart disease, stroke and diabetes.1
Children with disability who are able to participate in physical activities and have healthy diets are more likely to have better health outcomes over the longer term.2,3
The Australian Bureau of Statistics estimates 9,000 WA children aged 0 to five years (4.4%) had reported disability in 2018.4
In 2013, the Commissioner consulted with children and young people with disability aged between six and 18 years about the issues that were important to them. In this consultation, the participants highlighted that there was a lack of access to activities including sports and other community activities outside of school.5
In 2021, the Commissioner extended his Speaking Out Survey to include children and young people with disability, results from this consultation are forthcoming.
In 2006, the Physical Activity Study of Children and Adolescents with a Disability (PASCAD) was conducted to examine the physical activity of children/adolescents with a disability in metropolitan Perth. This study found that the majority of children and young people with a disability were not meeting the recommended physical activity guidelines. They also found that children with disability participated in a narrower range of activities, with very low participation rate in community-based team/group activities being the most noticeable difference.6
The children and young people in this study identified social barriers as one of the main obstacles to their physical activity. They reported that non-disabled peers and organisations did not know how to include them in physical activities.7
This study has not been repeated.
No other data exists on the physical health of WA children with disability.
Endnotes
- Australian Institute of Health and Welfare 2018, Chronic conditions and disability 2015, Cat no CDK 8, AIHW.
- Heller T et al 2011, Physical Activity and Nutrition Health Promotion Interventions: What is Working for People With Intellectual Disabilities?, Intellectual and Developmental Disabilities Vol 49, No 1.
- Australian Institute of Health and Welfare 2018, Chronic conditions and disability 2015, Cat no CDK 8, AIHW, p. 21.
- Data is sourced from a custom report provided to the Commissioner for Children and Young People WA by the Australian Bureau of Statistics based on the 2018 Disability, Ageing and Carers survey. The ABS uses the following definition of disability: ‘In the context of health experience, the International Classification of Functioning, Disability and Health (ICFDH) defines disability as an umbrella term for impairments, activity limitations and participation restrictions. In this survey, a person has a disability if they report they have a limitation, restriction or impairment, which has lasted, or is likely to last, for at least six months and restricts everyday activities’. Australian Bureau of Statistics 2016, Disability, Ageing and Carers, Australia, 2015, Glossary.
- Commissioner for Children and Young People 2013, Speaking Out About Disability: The views of Western Australian children and young people with disability, Commissioner for Children and Young People WA.
- Packer TL et al 2006, The Physical Activity Study of Children and Adolescents with a Disability, Curtin University of Technology.
- Ibid.
Last updated February 2022
Most children in WA are healthy, however, a significant proportion of children are not consistently engaging in healthy activities such as doing regular physical activity, eating a healthy diet and limiting their screen time. This increases their risk of health issues during their childhood and into adulthood. Children who are overweight or obese in childhood are also more likely to have health issues as adults.
While there is limited data, the data that is available suggests that most WA children aged 0 to five years are not meeting the recommended physical activity guidelines. Female children are also less likely to be meeting the physical activity recommendations than male children, even at this young age.
A healthy diet is also critical for children aged 0 to 5 years. Only a small proportion of WA children aged four to eight years are meeting the recommended guidelines for vegetable consumption. At the same time, while there is limited data on sugar consumption in this age group, it is important to reduce the amount of sugar in all children’s diets.
Aboriginal children are at greater risk of having physical health issues, including obesity, over their lifetime which contributes to a higher risk of chronic disease. Life expectancy is 8.6 years lower for Aboriginal men, and 7.8 years lower for Aboriginal women than non-Aboriginal WA adults.1 The difference in life expectancy is largely due to a higher incidence of chronic diseases, including heart disease, diabetes and various cancers.2
Socioeconomic disadvantage, including income levels, education and access to health services, have a significant influence on health in childhood.3 The data supports this finding, as Aboriginal people living in the most disadvantaged areas - a higher proportion of whom were living in remote Australia - have the lowest life expectancy.4
WA Department of Health’s strategy to improve health outcomes for Aboriginal children is encompassed in its WA Aboriginal Health and Wellbeing Framework 2015–2030.
Improving the physical health of children in WA will require multifaceted interventions where evidence-based community level programs are combined with population-level strategies. Some key policy strategies include:5
- policies and programs which improve and promote access to recreational physical activity, including the creation of more community-based environments that provide space for accessible recreational activity and safe unstructured outdoor play
- supporting all children and their parents, including those with disability and living in regional or remote areas, to overcome barriers to participation in playgroups, organised sport and other recreational activities
- policies and programs to ensure all children and young people have access to adequate and sustainable supply of affordable, healthy, nutritious food
- limiting the availability and appeal of unhealthy food and beverages through marketing regulations and taxation policies
- programs and policies, including education and information campaigns, to inform and support parents and carers to maximise health, physical activity and good nutrition, and limit screen time for children
- health advice and preventative services delivered to parents in primary healthcare settings
- programs, guidelines and infrastructure to enable schools to support regular physical activity and healthy eating
- broad strategies that address the social determinants of health including poverty and disadvantage.
Policies which aim to address rates of overweight or obese young children must also be formulated and voiced in ways which are sensitive and safe and give serious consideration to potentially harmful impacts on future self-esteem and body image.6,7
Data gaps
Limited robust and regular data is collected on the physical health of WA children aged 0 to 5 years. Patterns of nutrition and exercise behaviours are typically established in early childhood8 and it is important to collect and report this data.
The existing WA Department of Health, Health and Wellbeing Surveillance System collects data on nutrition and screen time for very young children but does not include data for physical activity for children under five years of age. Including survey questions related to children aged two to five years should be considered.
More information is needed on the prevalence of FASD in WA and greater awareness and knowledge of FASD in healthcare and family services is necessary to ensure children are properly diagnosed and able to be treated as early as possible.
There is very limited data on WA Aboriginal children’s physical health. In 2001 and 2002 the Telethon Institute for Child Health Research (now Telethon Kids Institute) conducted the Western Australian Aboriginal Child Health Survey. However, this survey has not been repeated. The Australian Bureau of Statistics conducted the National Aboriginal and Torres Strait Islander nutrition and physical activity survey (NATSINPAS) in 2011–2013. This survey provided limited data broken down by Australian jurisdiction. This survey has also not been repeated since.
The lack of data on WA Aboriginal children’s health is a significant gap given the considerably worse lifetime health outcomes of Aboriginal peoples compared to non-Aboriginal peoples.9
The limited data being collected and reported on the physical health of WA children in care is of concern. In particular, the lack of publicly available data on the proportion of children in care having the mandated initial medical examination needs to be urgently addressed.
Endnotes
- Australian Bureau of Statistics 2018, Life Tables for Aboriginal and Torres Strait Islander Australians, ABS.
- Australian Institute of Health and Welfare (AIHW) 2010, Contribution of chronic disease to the gap in adult mortality between Aboriginal and Torres Strait Islander and other Australians, Cat No IHW 48, AIHW.
- Australian Institute of Health and Welfare (AIHW) 2017, Australia’s Health 2016: 4.2 Social determinants of Indigenous health, AIHW.
- Australian Bureau of Statistics 2018, 3302.0 Life Tables for Aboriginal and Torres Strait Islander Australians, 2015–2017, ABS.
- For more information refer: Preventative Health Taskforce 2008, Australia: The Healthiest Country by 2020: A discussion paper prepared by the National Preventative Health Taskforce and Public Health Advocacy Institute of WA, Obesity [website].
- Russell-Mayhew S 2012, Mental Health, Wellness, and Childhood Overweight/Obesity, Journal of Obesity, Vol 2012.
- O’Dea JA 2012, Studies of obesity, body image and related health issues among Australian adolescents: how can programs in schools interact with and complement each other?, Journal of Student Wellbeing, Vol. 4 No 2.
- Murphey D et al 2011, Early Childhood Policy Focus: Healthy Eating and Physical Activity, Early Childhood Highlights: Child Trends, Vol 2, No 3.
- Australian Institute of Health and Welfare (AIHW) 2015, The health and welfare of Australia’s Aboriginal and Torres Strait Islander peoples: 2015 – Health and disability key points [website].
For further information on physical health for young children refer to the following resources:
- Australian Institute of Health and Welfare 2018, Physical activity across the life stages, Cat no PHE 225, AIHW.
- Child and Adolescent Health Services, Community Health Manual Guideline: Overweight and Obesity, WA Government.
- Commissioner for Children and Young People 2018, Policy Brief March 2018: Recreation, Commissioner for Children and Young People WA.
- Commissioner for Children and Young People 2014, Policy Brief November 2014: Obesity, Commissioner for Children and Young People WA.
- Lee A and Ride K 2018, Review of nutrition among Aboriginal and Torres Strait Islander people, Australian Indigenous HealthInfoNet.
- National Health and Medical Research Council 2013, Australian Dietary Guidelines: Providing the scientific evidence for healthier Australian diets, Canberra, National Health and Medical Research Council.