


Academic achievement

Academic achievement is one of the central aspects of schooling and, increasingly, a criterion for measuring school and system effectiveness. Academic achievement and improvement, appropriate to each student’s capabilities, is also essential for young people’s lifetime wellbeing. However, academic achievement is not the only desirable outcome from high school, and students who may not be achieving academically may be excelling in other areas.
Last updated May 2020
Good data is available on the academic achievement of WA children aged 6 to 11 years.
Overview
For children aged 6 to 11 years, academic progress each year is critical. At the same time, primary schools should support increasing independence and self-management, connectedness to school and community, and physical and emotional wellbeing.1
In the Commissioner’s 2019 Speaking Out Survey, 48.3 per cent of Year 4 to Year 6 students in WA reported that they do well or very well at school, while 42.0 per cent reported that they do OK.
NAPLAN results show improvements in the proportion of WA students achieving at or above the national minimum standard in Year 3 and Year 5 reading and numeracy from 2014 to 2018. However, in 2019, results for Year 3 and Year 5 numeracy declined while Year 3 reading improved and Year 5 reading remained stable.
Proportion of Year 3 and Year 5 students achieving at or above minimum standard in reading and numeracy, per cent, WA, 2014 to 2019
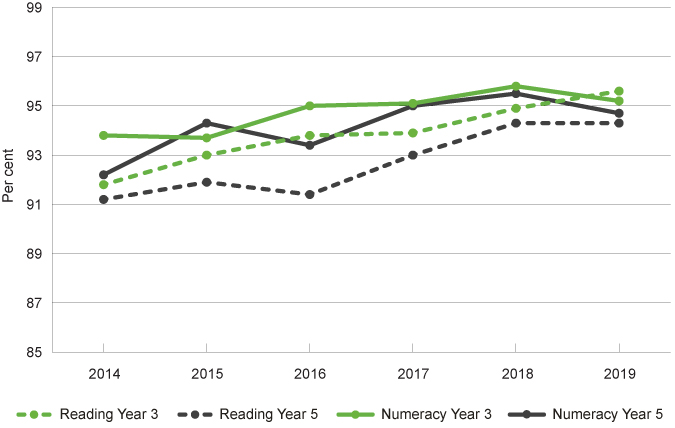
Source: Australian Curriculum, Assessment and Reporting Authority, NAPLAN National Results
The proportion of WA Aboriginal Year 5 students achieving at or above the national minimum standard for numeracy increased by 9.6 percentage points between 2008 and 2019 (from 61.6% to 71.2%).
Areas of concern
NAPLAN is the single publicly available indicator measuring student’s academic achievement. More data is required to measure students’ academic achievement in its broader meaning.
NAPLAN data shows that more than one-quarter of Aboriginal students in WA do not meet the national minimum standard for reading (26.6%) or numeracy (27.2%).
A significantly lower proportion of Aboriginal than non-Aboriginal Year 4 to Year 6 students reported that their parents or someone in their family often ask about their schoolwork or homework (48.9% compared to 61.7%). One-third (30.8%) of Aboriginal students answered that their parents ask sometimes and nearly one-in-five (18.3%) Aboriginal students said their parents rarely or never ask about schoolwork or homework.
Endnotes
- Lamb S et al 2015, Educational opportunity in Australia 2015: Who succeeds and who misses out, Centre for International Research on Education Systems, Victoria University for the Mitchell Institute.
Last updated May 2020
Since 2008, all students in Years 3, 5, 7 and 9 are tested annually using a common assessment tool under the National Assessment Program – Literacy and Numeracy (NAPLAN). The NAPLAN national minimum standard is “the agreed minimum acceptable standard of knowledge and skills without which a student will have difficulty making sufficient progress at school”.1 This tool is administered by the Australian Curriculum, Assessment and Reporting Authority (ACARA).
While NAPLAN provides Australia’s first standardised and comprehensive testing system by which to compare and target schools, communities and individual children that may need additional resources and attention,2 the system’s strengths and weaknesses continue to be discussed across the parent, teacher and policy and research communities (refer the Grattan Institute research paper, Widening gaps: What NAPLAN tells us about student progress, for a discussion).
Over-reliance on a single indicator to measure students’ academic progress is problematic and additional indicators are needed to assess students’ academic achievement in its broader meaning. However, no other data from educational bodies on students’ academic performance is currently publicly available.
In this section we have included the NAPLAN results for students in Years 3 and 5.3 Data from the Speaking Out Survey 2019 on students’ self-assessed achievement at school has also been included.
NAPLAN results for reading
From 2008 to 2019, the proportion of Year 3 students achieving at or above the national minimum standard for reading increased from 89.4 per cent to 95.6 per cent. The 2019 result is consistent with the average for all of Australia of 95.9 per cent.4
There was an equivalent improvement from 2008 to 2019 in reading scores across all Year 5 students (89.1% in 2008 to 94.3% in 2019).
|
Year |
Total |
Male |
Female |
Aboriginal |
Non-Aboriginal |
LBOTE |
|
|
Year 3 |
2008 |
89.4 |
87.0 |
91.9 |
57.3 |
92.1 |
88.0 |
|
2013 |
94.3 |
92.9 |
95.7 |
75.2 |
95.7 |
92.7 |
|
|
2014 |
91.8 |
90.1 |
93.5 |
63.1 |
94.0 |
90.1 |
|
|
2015 |
93.0 |
91.1 |
95.1 |
66.6 |
95.1 |
92.0 |
|
|
2016 |
93.8 |
92.0 |
95.7 |
71.3 |
95.5 |
92.9 |
|
|
2017 |
93.9 |
92.1 |
95.7 |
75.0 |
95.4 |
92.6 |
|
|
2018 |
94.9 |
93.8 |
96.2 |
73.7 |
96.6 |
94.7 |
|
|
2019 |
95.6 |
94.5 |
96.9 |
79.6 |
96.9 |
95.3 |
|
|
Year 5 |
2008 |
89.1 |
87.1 |
91.1 |
51.8 |
92.2 |
86.1 |
|
2013 |
96.0 |
95.0 |
97.0 |
79.0 |
97.3 |
94.5 |
|
|
2014 |
91.2 |
89.4 |
93.1 |
59.3 |
93.6 |
88.5 |
|
|
2015 |
91.9 |
90.1 |
93.8 |
63.4 |
94.2 |
90.4 |
|
|
2016 |
91.4 |
89.4 |
93.4 |
56.5 |
94.1 |
89.2 |
|
|
2017 |
93.0 |
91.3 |
94.9 |
65.5 |
95.2 |
91.6 |
|
|
2018 |
94.3 |
93.0 |
95.7 |
68.7 |
96.4 |
93.3 |
|
|
2019 |
94.3 |
92.7 |
96.2 |
71.9 |
96.2 |
95.2 |
Source: Australian Curriculum, Assessment and Reporting Authority, NAPLAN National Results
Proportion of Year 5 students achieving at or above national minimum standard in reading by selected characteristics, per cent, WA, 2014 to 2019
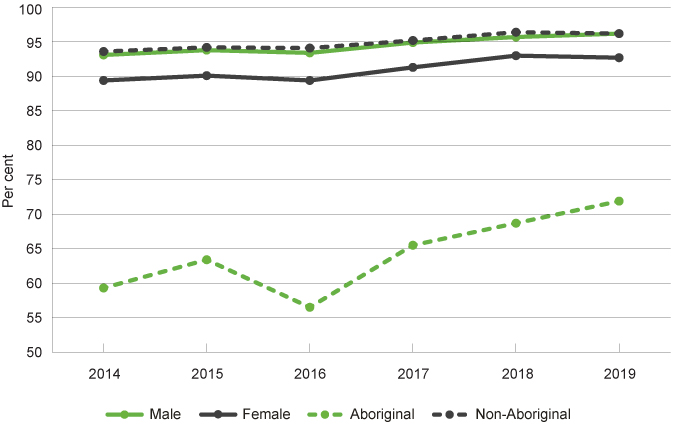
Source: Australian Curriculum, Assessment and Reporting Authority, NAPLAN National Results
A slightly higher proportion of female students achieved at or above the minimum standard than male students across all years.
The proportion of Year 5 students with a language background other than English (LBOTE) achieving at or above the national minimum standard for reading in 2019 was only slightly below non-LBOTE children (95.2% compared to 96.2%).
The proportion of Aboriginal children in Year 5 achieving at or above the national minimum standard for reading in 2019 was 71.9 per cent, which represents an increase from previous years. While the increase is positive, this was still well below the result for non-Aboriginal students of 96.2 per cent. It was also below the result for Aboriginal students Australia-wide of 77.6 per cent.5
The 2019 results show significant differences across geographic locations in the proportion of Year 3 and Year 5 students achieving at or above the minimum national standard in reading.
A much smaller proportion of Year 3 students achieved at or above the national minimum standard in very remote areas (77.8%) compared to students in the metropolitan area (96.7%), inner regional (95.2%), outer regional (93.0%) and remote (92.4%) areas.
|
Remotenesss area |
Total |
Aboriginal |
Non-Aboriginal |
|
|
Year 3 |
Metropolitan |
96.7 |
86.3 |
97.2 |
|
Inner regional |
95.2 |
84.9 |
95.9 |
|
|
Outer regional |
93.0 |
81.2 |
95.1 |
|
|
Remote |
92.4 |
80.1 |
97.2 |
|
|
Very remote |
77.8 |
62.7 |
95.7 |
|
|
Year 5 |
Metropolitan |
95.7 |
81.3 |
96.5 |
|
Inner regional |
94.3 |
79.5 |
95.5 |
|
|
Outer regional |
91.2 |
73.5 |
94.4 |
|
|
Remote |
88.6 |
68.5 |
96.2 |
|
|
Very remote |
69.2 |
46.0 |
93.6 |
Source: Australian Curriculum, Assessment and Reporting Authority, NAPLAN National Results
Results by Aboriginal status highlight that geolocation appears to have little effect on non-Aboriginal students, while for Aboriginal students, the reduction in achievement levels is pronounced.
Of significant concern is that only 46.0 per cent of Year 5 Aboriginal students in very remote areas achieved at or above the national minimum standard in reading. That is, the majority of Aboriginal students in Year 5 in very remote locations do not meet the minimum benchmark.
These results will be influenced by the high proportion of Aboriginal children and young people in very remote regions that speak Aboriginal languages at home rather than English. For example, the 2016 Census reported that 43.0 per cent of Aboriginal people living in the Kimberley speak more than one language at home6 and the second most spoken language (after English) was Kriol (16.7%).7 These proportions will be higher in the very remote areas of the Kimberley.
NAPLAN results for numeracy
For numeracy, the proportion of Year 5 students achieving at or above the national minimum standard increased from 91.1 per cent in 2008 to 94.7 per cent in 2019. The 2019 result is relatively consistent with the 2019 average for all of Australia of 95.4 per cent.8 Over the same period, the achievement of WA Year 3 students increased, but not significantly.
|
Year |
Total |
Male |
Female |
Aboriginal |
Non-Aboriginal |
LBOTE |
|
|
Year 3 |
2008 |
94.5 |
94.0 |
94.9 |
75.5 |
96.1 |
93.0 |
|
2013 |
95.4 |
94.9 |
95.9 |
76.9 |
96.8 |
93.6 |
|
|
2014 |
93.8 |
93.5 |
94.2 |
70.5 |
95.6 |
92.1 |
|
|
2015 |
93.7 |
93.5 |
93.9 |
69.5 |
95.6 |
92.3 |
|
|
2016 |
95.0 |
94.6 |
95.4 |
76.2 |
96.4 |
93.7 |
|
|
2017 |
95.1 |
94.4 |
95.7 |
77.4 |
96.5 |
93.8 |
|
|
2018 |
95.8 |
95.4 |
96.2 |
77.8 |
97.2 |
95.0 |
|
|
2019 |
95.2 |
94.6 |
95.8 |
74.5 |
96.8 |
94.5 |
|
|
Year 5 |
2008 |
91.1 |
91.5 |
90.7 |
61.6 |
93.7 |
89.7 |
|
2013 |
92.7 |
93.0 |
92.5 |
65.3 |
94.9 |
91.9 |
|
|
2014 |
92.2 |
92.2 |
92.2 |
61.2 |
94.5 |
90.8 |
|
|
2015 |
94.3 |
93.8 |
94.8 |
71.0 |
96.2 |
93.1 |
|
|
2016 |
93.4 |
93.1 |
93.6 |
65.8 |
95.5 |
91.9 |
|
|
2017 |
95.0 |
94.6 |
95.4 |
71.3 |
96.8 |
93.7 |
|
|
2018 |
95.5 |
95.2 |
95.8 |
75.3 |
97.1 |
94.8 |
|
|
2019 |
94.7 |
94.1 |
95.5 |
71.2 |
96.7 |
95.8 |
Source: Australian Curriculum, Assessment and Reporting Authority, NAPLAN National Results
Proportion of Year 5 students achieving at or above the national minimum standard in numeracy by selected characteristics, per cent, WA, 2014 to 2019
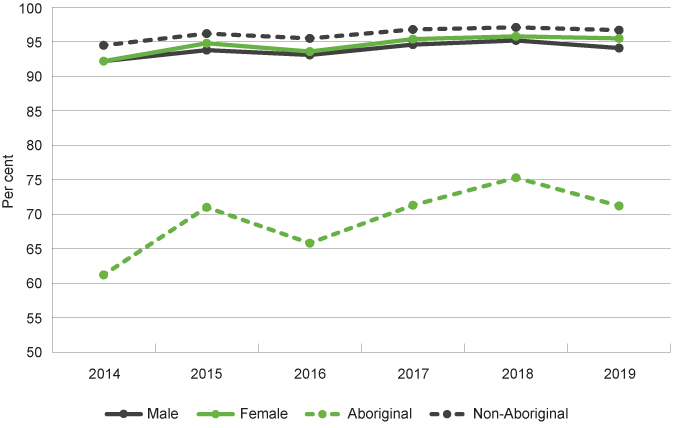
Source: Australian Curriculum, Assessment and Reporting Authority, NAPLAN National Results
The proportion of WA Aboriginal Year 5 students achieving at or above the national minimum standard for numeracy increased by 9.6 percentage points between 2008 and 2019 (from 61.6% to 71.2%), albeit with a decrease from 2018 to 2019 (from 75.3% to 71.2%).
Similar to the results for reading, 2019 achievement levels in numeracy were particularly low for Aboriginal students in very remote locations (51.9% for Year 3 and 43.1% for Year 5).9
|
Remoteness area |
Total |
Aboriginal |
Non-Aboriginal |
|
|
Year 3 |
Metropolitan |
96.4 |
84.1 |
97.0 |
|
Inner regional |
95.1 |
79.9 |
96.2 |
|
|
Outer regional |
93.2 |
76.9 |
96.1 |
|
|
Remote |
90.7 |
73.9 |
97.3 |
|
|
Very remote |
71.6 |
51.9 |
95.4 |
|
|
Year 5 |
Metropolitan |
96.1 |
80.6 |
96.9 |
|
Inner regional |
94.7 |
76.8 |
96.1 |
|
|
Outer regional |
92.2 |
75.4 |
95.2 |
|
|
Remote |
89.5 |
68.7 |
97.4 |
|
|
Very remote |
68.2 |
43.1 |
94.5 |
Source: Australian Curriculum, Assessment and Reporting Authority, NAPLAN National Results
These results by geographic region show a similar pattern to attendance rates for Aboriginal children across geographic locations. For example, low attendance rates in very remote locations correlate with a very low proportion of students reaching the national minimum standard in numeracy. For more information on attendance rates refer to the School attendance indicator.
Aboriginal students are at a very high risk of not reaching the minimum standard in comparison to non‑Aboriginal students. Across all domains, more than one-quarter of Year 5 Aboriginal students do not meet the national minimum standard.
|
Aboriginal |
Non-Aboriginal |
|
|
Reading |
26.6 |
2.7 |
|
Writing |
33.0 |
4.2 |
|
Spelling |
25.3 |
3.6 |
|
Grammar and punctuation |
38.5 |
5.1 |
|
Numeracy |
27.2 |
2.2 |
Source: Australian Curriculum, Assessment and Reporting Authority, NAPLAN National Results
NAPLAN cohort analysis across domains
NAPLAN data enables an assessment of student progress across cohorts, for example, the 2019 Year 5 cohort were the 2017 Year 3 cohort.
Across all domains except spelling, a lower proportion of the 2017 Aboriginal Year 3 student cohort were achieving or exceeding the minimum benchmark once they were in Year 5 in 2019. That is, a higher proportion of students are not meeting the benchmark two years later. This was generally not the case for the non-Aboriginal cohort (except in writing and grammar and punctuation where there were small declines in Year 5 in 2019).
|
Aboriginal |
Non-Aboriginal |
|||
|
Year 3 in 2017 |
Year 5 in 2019 |
Year 3 in 2017 |
Year 5 in 2019 |
|
|
Reading |
75.0 |
71.9 |
95.4 |
96.2 |
|
Writing |
75.7 |
65.6 |
96.5 |
94.6 |
|
Spelling |
71.2 |
73.2 |
94.4 |
95.3 |
|
Grammar and punctuation |
68.2 |
60.0 |
94.8 |
93.7 |
|
Numeracy |
77.4 |
71.2 |
96.5 |
96.7 |
Source: Australian Curriculum, Assessment and Reporting Authority, NAPLAN National Results
Proportion of students achieving at or above the national minimum standard across domains from Year 3 (2017) to Year 5 (2019) by Aboriginal status, per cent, WA, 2017 and 2019
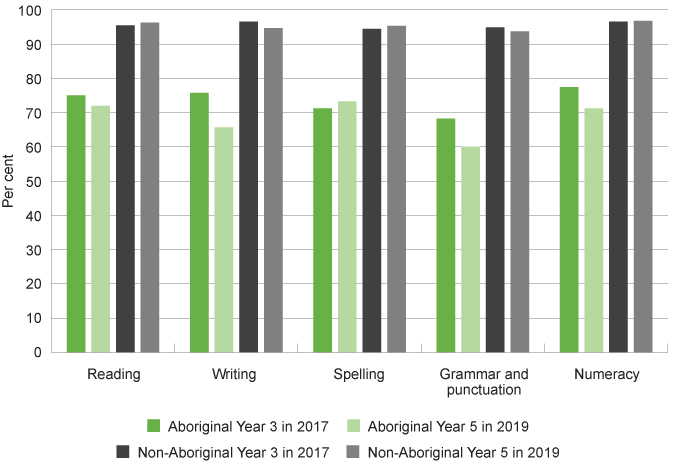
Source: Australian Curriculum, Assessment and Reporting Authority, NAPLAN National Results
Monitoring students’ progress across years is important as it highlights where students are not only not achieving the minimum standards but are also falling further behind each year. Measuring progress is important as it tells us about the value the education system adds by indicating what learning takes place in the classroom.10
Multiple factors influence student achievement levels. These include socioeconomic status, parental expectations, parents’ educational status, school advantage and regional differences. For example, it has been found that “bright students in disadvantaged schools show the biggest losses in potential”, making significantly “less progress than similarly capable students in high advantaged schools”.11 Other research has found that “children living in the most advantaged areas will on average achieve more than double the score in national proficiency tests in reading, writing and numeracy than those living in the most disadvantaged areas”.12
For many Aboriginal children, their capacity to learn through the formal education system is impacted by persistent social and economic disadvantage and the ongoing effects of inter-generational trauma.13,14
Speaking out Survey 2019
In 2019, the Commissioner for Children and Young People (the Commissioner) conducted the Speaking Out Survey which sought the views of a broadly representative sample of Year 4 to Year 12 students in WA on factors influencing their wellbeing.15
While NAPLAN measures student achievement in literacy and numeracy at a point in time, children in primary school are learning many other important skills including creativity, problem-solving and critical thinking. Children’s views on how well they are doing at school provide an important measure of their broader engagement in learning. In the Speaking Out Survey 2019, Year 4 to Year 6 students were asked ‘In general, how well do you do at school?’.
In 2019, 48.3 per cent of Year 4 to Year 6 students in WA reported that they do well or very well at school, while 42.0 per cent reported that they do OK.
|
Male |
Female |
Metropolitan |
Regional |
Remote |
Total |
|
|
Well or very well |
47.2 |
48.9 |
49.4 |
47.0 |
40.2 |
48.3 |
|
OK |
44.8 |
40.3 |
41.1 |
42.2 |
51.4 |
42.0 |
|
Not so well |
5.4 |
6.5 |
6.4 |
5.6 |
3.4 |
6.0 |
|
I'm not sure |
2.6 |
4.3 |
3.1 |
5.1 |
5.0 |
3.6 |
Source: Commissioner for Children and Young People WA 2020, Speaking Out Survey 2019 Data Tables [unpublished]
Six per cent of students reported that they were not doing so well at school, while 3.6 per cent of students were not sure.
No significant differences were measured for male or female students or students in different geographic areas.
There was also no significant difference between Aboriginal and non-Aboriginal Year 4 to Year 6 students’ views, with 90.6 per cent of Aboriginal students saying they were doing well, very well or OK compared to 90.3 per cent of non-Aboriginal students.
|
Non-Aboriginal |
Aboriginal |
|
|
Well or very well |
48.8 |
42.2 |
|
OK |
41.5 |
48.4 |
|
Not so well |
6.0 |
6.3 |
|
I'm not sure |
3.6 |
3.1 |
Source: Commissioner for Children and Young People WA 2020, Speaking Out Survey 2019 Data Tables [unpublished]
Endnotes
- Australian Curriculum, Assessment and Reporting Authority (ACARA) 2016, NAPLAN Achievement in Reading, Writing, Language Conventions and Numeracy. National Report for 2016, ACARA, p. v.
- Cassells R et al 2017, Educate Australia Fair?: Education Inequality in Australia, Focus on the States Series, Issue No. 5, Bankwest Curtin Economics Centre, p. 29.
- NAPLAN is in the process of transitioning from a paper test to an online test. In 2018, the majority of students took NAPLAN on paper, however, approximately 15 per cent of students nationally sat NAPLAN online, with variances to this figure in each state and territory. In 2019, around 50 per cent of schools nationally undertook NAPLAN online. The governing body ACARA advises that for the 2018 and 2019 transition years, the ‘online test results were equated with the pen-and-paper tests. Results for both the tests are reported on the same NAPLAN assessment scale. NAPLAN results, however, should always be interpreted with care.’ This is particularly the case in 2019 as ‘some students experienced disruptions due to connectivity issues’. Source: Australian Curriculum, Assessment and Reporting Authority 2019, National Assessment Program, Literacy and Numeracy: Achievement in Reading, Writing, Language Conventions and Numeracy - National Report for 2019, ACARA, p. v.
- Australian Curriculum, Assessment and Reporting Authority (ACARA) 2020, NAPLAN results, ACARA.
- Australian Curriculum, Assessment and Reporting Authority (ACARA) 2019, NAPLAN Achievement in Reading, Writing, Language Conventions and Numeracy - National Report for 2019, ACARA.
- In comparison, the 2016 Census reported that 75.2 per cent of all people in WA only spoke English at home.
- Australian Bureau of Statistics (ABS) 2017, 2016 Census: Aboriginal and/or Torres Strait Islander Peoples QuickStats: Kimberley, ABS [website].
- Australian Curriculum, Assessment and Reporting Authority (ACARA) 2019, NAPLAN Achievement in Reading, Writing, Language Conventions and Numeracy - National Report for 2019, ACARA.
- Ibid.
- Goss P et al 2018, Measuring student progress: A state-by-state report card, Grattan Institute.
- Goss P and Sonnemann J 2016, Widening gaps: What NAPLAN tells us about student progress, Grattan Institute, p. 31
- Cassells R et al 2017, Educate Australia Fair?: Education Inequality in Australia, Focus on the States Series, Issue No. 5, Bankwest Curtin Economics Centre, p. 68
- SNAICC – National Voice for our Children (SNAICC) et al 2018, Family Matters Report 2018, SNAICC, p. 10.
- Gillan K et al 2017, The Case for Urgency: Advocating for Indigenous voice in education, Australian Council for Educational Research, p. 2.
- Commissioner for Children and Young People WA 2020, Speaking Out Survey: The views of WA children and young people on their wellbeing - a summary report, Commissioner for Children and Young People WA.
Last updated May 2020
Students require different levels and types of support to assist them with their learning and to enable their ongoing engagement with education. Teachers who provide help for learning are valued by students as it enables improved access to the curriculum, reduced anxiety and facilitates experiences of success.
Further, family processes and practices are strongly related to students’ academic, social, emotional and behavioural outcomes. Studies have shown that when families are interested in their child’s education and engaged with their school, student outcomes are improved.1,2
Help in the classroom
According to results from the Commissioner’s 2019 Speaking Out Survey, one-half (50.3%) of Year 4 to Year 6 students almost always get extra help from their teachers in class if they need it. Forty per cent of students reported getting such help sometimes and 6.6 per cent almost never.
A lower proportion of Year 4 to Year 6 students in remote areas than in regional and metropolitan areas reported almost always getting extra help when needed (45.3% compared to 53.2% and 50.1%), however, the difference was not statistically significant.
|
Male |
Female |
Metropolitan |
Regional |
Remote |
Total |
|
|
Almost always |
49.7 |
50.6 |
50.1 |
53.2 |
45.3 |
50.3 |
|
Sometimes |
39.8 |
41.0 |
40.5 |
35.9 |
44.5 |
40.0 |
|
Almost never |
7.7 |
5.3 |
6.7 |
5.7 |
7.2 |
6.6 |
|
I don't know |
2.9 |
3.1 |
2.7 |
5.1 |
3.0 |
3.1 |
Source: Commissioner for Children and Young People WA 2020, Speaking Out Survey 2019 Data Tables [unpublished]
There were broadly no differences in the responses of Aboriginal and non-Aboriginal Year 4 to Year 6 students to this question.
|
Aboriginal |
Non-Aboriginal |
Total |
|
|
Almost always |
48.4 |
50.4 |
50.3 |
|
Sometimes |
42.1 |
39.9 |
40.0 |
|
Almost never |
6.7 |
6.6 |
6.6 |
|
I don't know |
2.8 |
3.2 |
3.1 |
Source: Commissioner for Children and Young People WA 2020, Speaking Out Survey 2019 Data Tables [unpublished]
National School Opinion Survey
In the 2016 National School Opinion Survey, 84.0 per cent of participating Year 5 and Year 6 students in government schools either agreed or strongly agreed with the statement “My teachers provide me with useful feedback about my schoolwork”.3 Ten per cent neither agreed nor disagreed with this statement, while five per cent disagreed or strongly disagreed.4
Taking into account the different research methodologies and questions used between the NSOS and the School and Learning Consultation, the responses are relatively consistent and highlight that most students are getting the help they need at school; however, a small proportion of students feel as if they are not receiving the support they need for learning.
Parental engagement in children’s learning
Students in the 2019 Speaking Out Survey were asked a range of questions about their family’s involvement in their educational activities. Three-in-five (60.8%) Year 4 to Year 6 students reported that their parents or someone in their family often ask about their schoolwork or homework. One-quarter (25.2%) of students said their parents ask sometimes and more than one-in-ten (12.1%) students responded that their parents rarely or never ask about schoolwork or homework.
|
Male |
Female |
Metropolitan |
Regional |
Remote |
Total |
|
|
Often |
60.1 |
61.8 |
62.6 |
56.2 |
52.0 |
60.8 |
|
Sometimes |
23.4 |
26.7 |
24.6 |
26.8 |
27.6 |
25.2 |
|
Rarely/never |
14.5 |
9.7 |
11.1 |
14.9 |
14.9 |
12.1 |
|
I'm not sure |
2.1 |
1.8 |
1.7 |
2.0 |
5.6 |
2.0 |
Source: Commissioner for Children and Young People WA 2020, Speaking Out Survey 2019 Data Tables [unpublished]
Male and female Year 4 to Year 6 students were equally likely to report that their parents often ask about their schoolwork or homework (60.1% compared to 61.8%), but a higher proportion of male than female students answered that their parents rarely or never ask about this (14.5% male compared to 9.7% female).
The Australian Bureau of Statistics (ABS) collects data on informal learning by children in the home and publishes the results in the Childhood Education and Care publication.5 According to this survey, 84.3 per cent of WA children aged three to eight years were assisted with homework or other educational activities by their parents.6 This data item is not collected for children older than eight years of age.
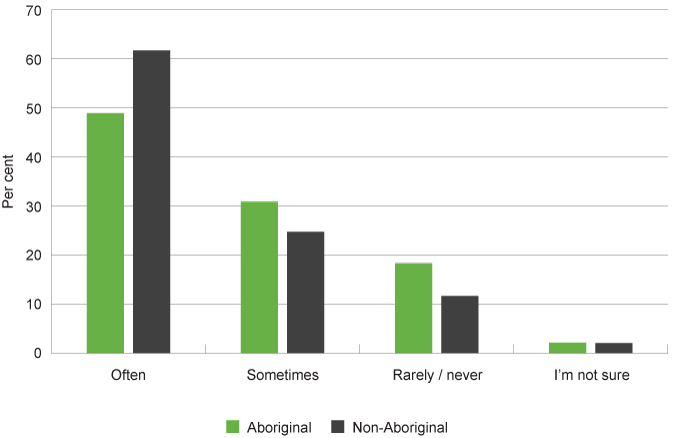
A significantly lower proportion of Aboriginal than non-Aboriginal Year 4 to Year 6 students reported that their parents or someone in their family often ask about their schoolwork or homework (48.9% compared to 61.7%). One-third (30.8%) of Aboriginal students answered that their parents ask sometimes and nearly one-in-five (18.3%) Aboriginal students said their parents rarely or never ask about schoolwork or homework.
|
Aboriginal |
Non-Aboriginal |
Total |
|
|
Almost always |
48.9 |
61.7 |
60.8 |
|
Sometimes |
30.8 |
24.7 |
25.2 |
|
Almost never |
18.3 |
11.6 |
12.1 |
|
I don't know |
2.1 |
2.0 |
2.0 |
Source: Commissioner for Children and Young People WA 2020, Speaking Out Survey 2019 Data Tables [unpublished]
Proportion of Year 4 to Year 6 students saying their parents or someone in their family often, sometimes, rarely or never ask about school-work or homework by Aboriginal status, per cent, WA, 2019
Source: Commissioner for Children and Young People WA 2020, Speaking Out Survey 2019 Data Tables [unpublished]
In other research with younger children, the 2015 Report on Wave 5 of the Longitudinal Study of Indigenous Children (LSIC) reported that the majority of parents (79.2% of parents with children who received homework) checked the homework of their Year 2 or Year 3 children at least a few times a week.7
Endnotes
- Emerson L et al 2012, Parental engagement in learning and schooling: Lessons from research, Australian Research Alliance for Children and Youth.
- Desforges C and Abouchaar A 2003, The Impact of Parental Involvement, Parental Support and Family Education on Pupil Achievement and Adjustment: A Literature Review, Research Report No 433, Department for Education and Skills UK.
- Results from the National School Opinion Survey 2016, custom report prepared by WA Department of Education for Commissioner for Children and Young People WA. All WA government schools are required to administer parent, student and staff National School Opinion Surveys (NSOS) at least every two years, commencing in 2014. The Australian Curriculum Assessment and Reporting Authority (ACARA) was responsible for the development and implementation of the NSOS. The WA Department of Education and individual schools are also able to add additional questions to the survey. In WA, the first complete (although non-mandatory) implementation of the survey was conducted in government schools in 2016. The next survey was conducted in 2018 and this data will be published when compiled. The data should be interpreted with caution as the survey is relatively new and there is a consequent lack of an agreed baseline for results.
- National School Opinion Survey 2016, custom report prepared by WA Department of Education for Commissioner for Children and Young People WA.
- Australian Bureau of Statistics 2018, Childhood Education and Care, Australia, June 2017, cat No. 4402.0
- Australian Bureau of Statistics 2018, Childhood Education and Care, Australia, June 2017, cat No. 4402.0, Table 20: Parental Involvement in Informal Learning – Western Australia.
- Department of Social Services 2015, Footprints in Time: The Longitudinal Study of Indigenous Children—Report from Wave 5, Department of Social Services, p. 37.
Last updated May 2020
Schooling does not occur in isolation for children and young people. They bring with them the impact of their circumstances, shaped by economic, environmental and social factors. These circumstances can sometimes give rise to emotional concerns which have the potential to impact student thinking, learning, behaviours and relationships. Emotional support facilitates learning and social and emotional development, particularly if provided when children or young people are facing challenges.1
Support may be informal, through quality interpersonal relationships or formal systems such as school psychologists.
Research into resilience highlights the importance of having at least one stable, caring and supportive relationship between a child and the important adults in his or her life. Aside from family, these relationships can include neighbours, providers of early care and education and teachers.2
Limited data exists on the number or proportion of students who receive support to respond to emotional or other non-schoolwork issues at school.
In the 2019 Speaking Out Survey, 82.5 per cent of Year 4 to Year 6 students reported that it is very much or pretty much true that there is a teacher or another adult at their school who really cares about them.3
The survey found that a significantly higher proportion of female than male Year 4 to Year 6 students reported it is very much true that there is a teacher or other adult at school who really cares about them (48.6% compared to 39.6%). Furthermore, a significantly higher proportion of Aboriginal than non-Aboriginal Year 4 to Year 6 students reported that it is very much true that there is a teacher or other adult at school who really cares about them (56.4% compared to 43.4%).4
For more information refer to the A sense of belonging and supportive relationships at school indicator.
National School Opinion Survey
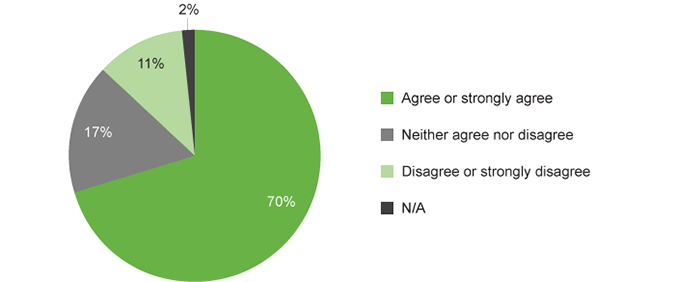
In the 2016 National School Opinion Survey, 70.0 per cent of participating Year 5 to Year 6 students in government schools either agreed or strongly agreed with the statement “I can talk to my teachers about my concerns”. Seventeen per cent neither agreed nor disagreed with this statement, while 11.0 per cent disagreed or strongly disagreed.
National School Opinion Survey: Proportion of Year 5 and Year 6 government school students saying they can talk to teachers about their concerns, per cent, WA, 2016
Source: National School Opinion Survey 2016, custom report prepared by WA Department of Education for the Commissioner for Children and Young People WA (unpublished)
Endnotes
- National Scientific Council on the Developing Child 2015, Supportive Relationships and Active Skill-Building Strengthen the Foundations of Resilience: Working Paper 13, Center for Child Development, Harvard University.
- Ibid.
- Commissioner for Children and Young People WA 2020, Speaking Out Survey 2019 Data Tables [unpublished].
- Ibid.
Last updated May 2020
Research suggests that teachers’ expectations of their students do not merely forecast student outcomes, but that they can influence outcomes; that is, low (or high) expectations can modify student behaviour.1 In the 2016 School and Learning Consultation, participating students identified that teachers who support and encourage them to do their best and talk about their aspirations, increase students’ motivation to engage.2 Expectations of teachers and other school staff
According to the Speaking Out Survey 2019, two-thirds (65.9%) of Year 4 to Year 6 students agree it is very much true that there is a teacher at their school who expects them to do well. A further one-quarter (26.8%) of students say this is pretty much true. Around 7 per cent of Year 4 to Year 6 students feel this is only a little true (5.5%) for them or not at all (1.7%).
Regional students are more likely than their remote and metropolitan counterparts to agree that it is very much true that a teacher expects them to do well (73.7% compared to 68.2% and 64.0%).
|
Male |
Female |
Metropolitan |
Regional |
Remote |
Total |
|
|
Very much true |
64.4 |
67.5 |
64.0 |
73.7 |
68.2 |
65.9 |
|
Pretty much true |
28.2 |
25.3 |
29.1 |
19.0 |
21.7 |
26.8 |
|
A little true |
5.2 |
6.0 |
5.3 |
5.3 |
7.9 |
5.5 |
|
Not at all true |
2.2 |
1.1 |
1.7 |
1.9 |
2.2 |
1.7 |
Source: Commissioner for Children and Young People WA 2020, Speaking Out Survey 2019 Data Tables [unpublished]
In the 2016 National School Opinion Survey,3 95.0 per cent of participating students either agreed or strongly agreed with the statement “My teachers expect me to do my best”. Three per cent neither agreed nor disagreed with this statement, while two per cent disagreed or strongly disagreed.
Parental expectations
Research shows that there is a strong relationship between parental aspirations and expectations and their child’s actual academic outcomes.4 There is evidence suggesting that parental expectations for children’s academic achievement predict educational outcomes more than other measures of parental involvement, such as attending school events.5
In the School and Learning Consultation, high expectations from family members were generally seen as a positive influence for school and learning; however, students were careful to temper comments with provisos such that expectations must be related to the student’s ability and interest, and facilitated by support from family members.6
In the 2019 Speaking Out Survey, almost three-quarters (73.5%) of Year 4 to Year 6 students reported that it is very much true that there is a parent or another adult at home who believes that they will achieve good things.
|
Male |
Female |
Metropolitan |
Regional |
Remote |
Total |
|
|
Very much true |
73.2 |
74.2 |
75.1 |
68.2 |
69.5 |
73.5 |
|
Pretty much true |
19.4 |
19.2 |
18.3 |
23.2 |
21.2 |
19.4 |
|
A little true |
6.8 |
5.3 |
5.8 |
7.2 |
6.8 |
6.1 |
|
Not at all true |
0.6 |
1.3 |
0.7 |
1.3 |
2.4 |
1.0 |
Source: Commissioner for Children and Young People WA 2020, Speaking Out Survey 2019 Data Tables [unpublished]
No significant difference was measured between male and female students or students in different geographic areas.
|
Aboriginal |
Non-Aboriginal |
Total |
|
|
Very much true |
65.5 |
74.1 |
73.5 |
|
Pretty much true |
18.7 |
19.4 |
19.4 |
|
A little true |
11.0 |
5.8 |
6.1 |
|
Not at all true |
4.7 |
0.7 |
1.0 |
Source: Commissioner for Children and Young People WA 2020, Speaking Out Survey 2019 Data Tables [unpublished]
The survey found that a significantly lower proportion of Aboriginal than non-Aboriginal Year 4 to Year 6 students reported it was very much true that there is a parent or another adult at home who believes they will achieve good things (65.5% compared to 74.1%).
Endnotes
- Gershson S and Papageorge N 2018, The power of teacher expectations: how racial bias hinders student attainment, Education Next, winter 2018.
- Commissioner for Children and Young People 2018, School and Learning Consultation: Technical Report, Commissioner for Children and Young People WA, Perth, p. 77.
- Results from the National School Opinion Survey 2016, custom report prepared by WA Department of Education for Commissioner for Children and Young People WA. All WA government schools are required to administer parent, student and staff National School Opinion Surveys (NSOS) at least every two years, commencing in 2014. The Australian Curriculum Assessment and Reporting Authority (ACARA) was responsible for the development and implementation of the NSOS. The WA Department of Education and individual schools are also able to add additional questions to the survey. In WA, the first complete (although non-mandatory) implementation of the survey was conducted in government schools in 2016. The next survey was conducted in 2018 and this data will be published when compiled. The data should be interpreted with caution as the survey is relatively new and there is a consequent lack of an agreed baseline for results.
- Emerson L et al. 2012, Parental engagement in learning and schooling: Lessons from research, Australian Research Alliance for Children and Youth.
- Child Trends Databank 2014, Parental Expectations for their Children’s Educational Attainment: Indicators of Child and Youth Well-being.
- Commissioner for Children and Young People 2018, School and Learning Consultation: Technical Report, Commissioner for Children and Young People WA, p. 104.
Last updated May 2019
Students’ perceptions of the relevance and value of educational content influence their engagement in school, learning and learning behaviours. Given these perceptions are partly framed by the curriculum and the way it is taught, listening to student views on the curriculum content and its relevance are essential considerations for enhancing engagement with school and learning.
The 2019 Speaking Out Survey did not specifically ask children in Years 4 to 6 whether what they were learning was seen as useful.
National School Opinion Survey
In the 2016 National School Opinion Survey,1 1 per cent of participating Year 5 to Year 6 students in government schools either agreed or strongly agreed with the statement “My school gives me opportunities to do interesting things”. Eleven per cent neither agreed nor disagreed with this statement, while seven per cent disagreed or strongly disagreed.
This data item has only limited relevance for this measure as ‘interesting things’ could be interpreted very differently by different children and these ‘things’ may or may not develop useful skills and knowledge.
Limited data exists on the opinions of children aged 6 to 11 years regarding whether they have opportunities to learn and develop useful skills and knowledge.
Endnotes
- Results from the National School Opinion Survey 2016, custom report prepared by WA Department of Education for Commissioner for Children and Young People WA. All WA government schools are required to administer parent, student and staff National School Opinion Surveys (NSOS) at least every two years, commencing in 2014. The Australian Curriculum Assessment and Reporting Authority (ACARA) was responsible for the development and implementation of the NSOS. The WA Department of Education and individual schools are also able to add additional questions to the survey. In WA, the first complete (although non-mandatory) implementation of the survey was conducted in government schools in 2016. The next survey was conducted in 2018 and this data will be published when compiled. The data should be interpreted with caution as the survey is relatively new and there is a consequent lack of an agreed baseline for results.
Last updated May 2020
There is limited recent data on the academic achievement of WA children in care aged 6 to 11 years.
At 30 June 2019, there were 1,618 WA children in care aged between five and nine years, more than one-half of whom (55.1%) were Aboriginal.1
In 2016, the WA Department of Communities reported that only 66.1 per cent of respondent students in care were meeting the NAPLAN minimum standards in that year. Aboriginal students were achieving this standard at a lower rate than non-Aboriginal students (55.6% compared to 76%).2 There has been no more recent reporting on this measure.
The Australian Institute of Health and Welfare (AIHW) examined the academic performance of children in care across Australia in 2013, by linking the data from the Child Protection National Minimum Data Set (CP NMDS) and the National Assessment Program – Literacy and Numeracy (NAPLAN). Among the study population, National Minimum Standard achievement rates varied across the five assessment domains (reading, writing, spelling, grammar and punctuation, and numeracy). Minimum standard achievement rates ranged between 74 and 82 per cent for Year 3 students and 67 and 83 per cent for Year 5 students.3 This data was not disaggregated by state and WA results are therefore not available.
These achievement levels are significantly below the average levels for other students in Australia who are not in out-of-home care (e.g. around 95% for Year 3 and Year 5 reading and numeracy). However, as AIHW note, the academic achievement of children in care is likely to be affected by complex personal histories and multiple aspects of disadvantage (including poverty, maltreatment, family dysfunction and instability in care and schooling).4 Nevertheless, when removing a child from their family and placing them into care it is critical that their lifetime outcomes are improved as a result, and educational achievement is a key component of this.
In 2017, CREATE Foundation asked 1,275 Australian children and young people aged 10 to 17 years about their lives in the care system. CREATE Foundation noted that the recruitment of participants proved difficult and this resulted in a non-random sample with the possibility of bias.5
The survey found that 54.4 per cent of respondents would like additional support to help them do well at school. Of these, 29.8 per cent requested extra help with schoolwork and 23.3 per cent requested extra help with homework. A significant proportion (17.4%) also noted they would like additional financial support and resources (e.g. computers and tablets).6
This survey data is not available by jurisdiction or age group.
Other Australian research suggests that support from carers and their caseworkers most strongly predicted school engagement for children in care.7 This research also found that children and young people in care reported lower aspirations for themselves and saw their parents as having lower aspirations for them than children and young people not in care.8
Children in care experience high vulnerability and educational risk and there must be a continued focus on improving their wellbeing.
Endnotes
- Department of Communities 2019, Annual Report: 2018-19, WA Government p. 26.
- WA Department for Child Protection and Family Support 2016, Outcomes framework for children in out-of-home care in Western Australia: 2015-2016 Baseline Indicator Report, Department for Child Protection and Family Support.
- Australian Institute of Health and Welfare (AIHW) 2015, Educational outcomes for children in care: Linking 2013 child protection and NAPLAN data, Cat No CWS 54, AIHW, p. 7.
- Australian Institute of Health and Welfare (AIHW) 2015, Educational outcomes for children in care: Linking 2013 child protection and NAPLAN data, Cat No CWS 54, AIHW.
- McDowall JJ 2018, Out-of-home care in Australia: Children and young people’s views after five years of National Standards, CREATE Foundation, pp. 17-19.
- Ibid, p. 82.
- Tilbury C et al 2014, Making a connection: School engagement of young people in care, Child & Family Social Work, Vol 19, pp. 455-466.
- Ibid, p. 463.
Last updated May 2020
The Australian Bureau of Statistics Disability, Ageing and Carers, 2018 data collection reports that approximately 30,200 WA children and young people (9.2%) aged five to 14 years have reported disability.1,2
The UN Convention on the Rights of Persons with Disabilities requires that children with disability shall be given the assistance required to participate effectively in education and training and to be prepared for employment conducive to the child’s individual development.3
It is also a national requirement under the Disability Standards for Education 2005 that students with disability can access and participate in education on the same basis as other students. A key aspect of the standards is that education providers must make ‘reasonable adjustments’ to ensure that a student with disability has comparable opportunities and choices with those offered to students without disability.4
Reasonable adjustments may include changes to the way that teaching and learning is provided, changes to the classroom or school environment, the way that students’ progress and achievements are assessed and reported to parents, the provision of personal care and planning to meet individual needs, as well as professional learning for teachers and support staff.
The Nationally Consistent Collection of Data on School Students with Disability in Education provides a detailed snapshot of students receiving an adjustment for disability across Australia.5 This collection is still in the early stages of implementation and the data cannot be compared across states, however, the data for WA shows that in 2018, one in five (19.9%) WA students received an adjustment for disability.
|
Category of disability |
2016 |
2017 |
2018 |
|
Cognitive |
10.1 |
11.8 |
11.4 |
|
Physical |
4.5 |
5.0 |
4.6 |
|
Sensory |
0.8 |
0.8 |
0.8 |
|
Social-emotional |
2.2 |
2.9 |
3.2 |
|
All categories of disability |
17.6 |
20.5 |
19.9 |
Source: ACARA, School Students with Disability
This data is not disaggregated by age, geographic location or Aboriginal status.
While the Nationally Consistent Collection of Data on School Students with Disability in Education provides information on the number of children receiving adjustments for disability, it does not report on the educational outcomes or experiences of children with disability.
The 2015 Federal Senate Inquiry into the Education system for children with disability found that there were low or, in some cases, no expectations of students with disabilities, that is, educators and other students often fail to recognise students with disabilities as capable of learning to their full potential.6
Similar to children without disability, parental expectations of children with disability have been shown to have a significant, yet sometimes detrimental, influence on children’s academic outcomes. This is partly due to the disability ‘label’ which has a range of negative implications, particularly on children’s self-concept which influences social and academic outcomes.7
Measuring educational outcomes for children and young people with disability and/or long-term health issues is challenging.8 Experts recommend that when using standardised testing (such as NAPLAN), an accommodated or alternative assessment is available for children and young people with special educational needs.9 This is not currently available within NAPLAN, and while NAPLAN is a standardised process for all students to complete, evidence suggests that children and young people with disability often do not participate.10
For those students who are participating in the NAPLAN assessments, ACARA does not disaggregate the results to report specifically on the results of children with disability. Therefore, there is limited ability to measure whether current policies and practices are supporting the educational progress of students with disability.
Further data and research on the educational outcomes and experiences of WA children and young people with disability is needed.
More than 300 Year 7 to Year 12 students with disability who attend mainstream classes or programs participated in the Speaking Out Survey 2019. For more information refer to the Academic Achievement indicator for the 12 to 17 years age group.
Endnotes
- The ABS uses the following definition of disability: ‘In the context of health experience, the International Classification of Functioning, Disability and Health (ICFDH) defines disability as an umbrella term for impairments, activity limitations and participation restrictions… In this survey, a person has a disability if they report they have a limitation, restriction or impairment, which has lasted, or is likely to last, for at least six months and restricts everyday activities.’ Australian Bureau of Statistics 2016, Disability, Ageing and Carers, Australia, 2015, Glossary.
- Australian Bureau of Statistics 2020, Disability, Ageing and Carers, Australia, 2018, Western Australia, Table 1.1 Persons with disability, by age and sex, estimate, and Table 1.3 Persons with disability, by age and sex, proportion of persons.
- Article 23, United Nations 1989, Convention on the Rights of the Child, United Nations Human Rights, Office of the High Commissioner.
- Department of Education and Training, Disability Standards for Education 2005 Fact Sheet, Australian Government.
- Nationally Consistent Collection of Data on School Students with Disability in Education Council, 2016 emergent data on students in Australian schools receiving adjustments for disability.
- Education and Employment References Committee, 2016, Access to real learning: the impact of policy, funding and culture on students with disability, Commonwealth of Australia.
- McCoy S et al 2016, The role of parental expectations in understanding social and academic well-being among children with disabilities in Ireland, European Journal of Special Needs Education, Vol 31, No 4.
- Mitchell D 2010, Education that fits: Review of international trends in the education of students with special educational needs, July 2010, University of Canterbury.
- Douglas G et al 2012, Measuring Educational Engagement, Progress and Outcomes for Children with Special Educational Needs: A Review, Department of Disability, Inclusion and Special Needs (DISN), School of Education, University of Birmingham.
- The Australian Research Alliance for Children and Youth (ARACY) 2013, Inclusive Education for Students with Disability: A review of the best evidence in relation to theory and practice, ARACY, p. 29.
Last updated May 2020
Supporting student engagement and academic achievement is important. There must be an ongoing commitment to improving the achievement of students at or below the national minimum standard. Policy and practice must focus on addressing the complex barriers that impede our most vulnerable children throughout their school years.1
Schools can employ several approaches to support children’s academic achievement and engagement in school. To encourage attendance and improve educational outcomes for all children and young people, schools need to ensure a welcoming, supportive and inclusive environment for students and their families. Targeted teaching that is tailored to each student’s capability and level is required to reduce the significant achievement gap that exists between high achieving and low achieving students. This will ensure high achieving students are stretched and low achieving students are supported.2
Students’ motivation and engagement improves when teachers and staff foster a school and classroom environment that supports both learning and emotional development. For more information, refer to the Commissioner for Children and Young People School and Learning Consultation: Technical Report.
Teachers and schools serving disadvantaged communities need sufficient resources to implement initiatives to help them build capacity. On the ground initiatives that support disadvantaged communities can include attracting high-performing teachers and principals, instigating mentoring programs for teachers, employing a teacher with expertise in Aboriginal student learning outcomes, and increased monitoring of school performance.3
Parental engagement is also a key part of promoting and improving children’s learning capabilities and wellbeing. Refer to the Commissioner’s resource How can you help your child to be engaged in school and learning? for more information for parents, carers and family.
To improve the academic achievement and participation of Aboriginal children, it is essential to engage their parents and caregivers as educators in the first five years of life and create a strong relationship between home and school based on common understandings and shared knowledge. This involves ensuring parents and caregivers are well-informed and have an opportunity to be active participants in their child’s education.4 For further information on education for Aboriginal children and young people refer to the Commissioner’s policy brief: Aboriginal children and young people’s education.
For students in out-of-home care, raising educational aspirations is critical. Research suggests that for children in care having a specific end-goal of education in mind can assist students to feel a sense of purpose and connection with their school environment. This will provide students with a reason to invest time and effort in learning and achieving, and foster engagement.5
Data gaps
Robust data on the academic achievement of children with disability is needed; without this it is difficult to assess whether children with disability are being provided with consistent and equitable access to education and support and to allow comparisons with children without disability.
There is also no recent and publicly available data on the academic achievement of children in care in WA. Children in care are a highly vulnerable group and it is critical they have appropriate support and opportunities to achieve academically.
Endnotes
- Cassells R et al 2017, Educate Australia Fair?: Education Inequality in Australia, Bankwest Curtin Economics Centre, Focus on the States Series, Issue No. 5.
- Goss P and Sonnemann J 2016, Widening gaps: What NAPLAN tells us about student progress, Grattan Institute.
- Centre for International Research on Education Systems 2015, Low SES School Communities National Partnership: Evaluation of staffing, management and accountability initiatives, Victoria University, pp. 8-11.
- Zubrick SR et al 2006, The Western Australian Aboriginal Child Health Survey: Improving the Educational Experiences of Aboriginal Children and Young People, Curtin University of Technology and Telethon Institute for Child Health Research.
- Tilbury C et al 2014, Making a connection: school engagement of young people in care, Child & Family Social Work, Vol 19, pp. 455-466.
For more information on educational achievement refer to the following resources:
- Australian Research Alliance for Children and Youth (ARACY) 2018, Parent Engagement in communities with low socioeconomic status, ARACY.
- Cassells R et al 2017, Educate Australia Fair?: Education Inequality in Australia, Focus on the States Series, Issue No. 5, Bankwest Curtin Economics Centre.
- Goss P and Sonnemann J 2016, Widening gaps: What NAPLAN tells us about student progress, Grattan Institute.
- Gillan K et al 2017, The Case for Urgency: Advocating for Indigenous voice in education, Australian Council for Educational Research.
- Jensen B 2010, Measuring what matters: student progress, Grattan Institute.
- Lamb S et al 2015, Educational opportunity in Australia 2015: Who succeeds and who misses out, Centre for International Research on Education Systems, Victoria University for the Mitchell Institute.