


School attendance

The period from 12 to 17 years of age is a critical time for children and young people as they transition from childhood to adolescence and into young adulthood. Regular attendance and engagement in high school is an essential component of this journey.
Last updated June 2020
Good data is available on whether WA young people aged 12 to 17 years are attending school.
Overview
While engagement with school and learning is multifaceted, absence is a marker of disengagement and helps predict school completion and future engagement in work or further study.1 Research shows that a higher rate of absence is directly related to a lower level of academic achievement2and can lead to diminished employment prospects and, for some, adverse life outcomes including social exclusion and poverty.3
Regular attendance during high school is also directly related to Year 12 completion. Young people with Year 12 qualifications (or equivalent) are more likely to continue further study and have better employment outcomes.4
Most young people have high attendance rates at school. In WA, the student attendance rate for Year 7 to Year 10 is slightly below the national average (89.0% compared to 89.9%) and in 2019 WA recorded the lowest overall attendance rate for the past six years (89.0%).
Attendance rates of students in Year 7 to Year 10, per cent, WA and Australia, 2014 to 2019
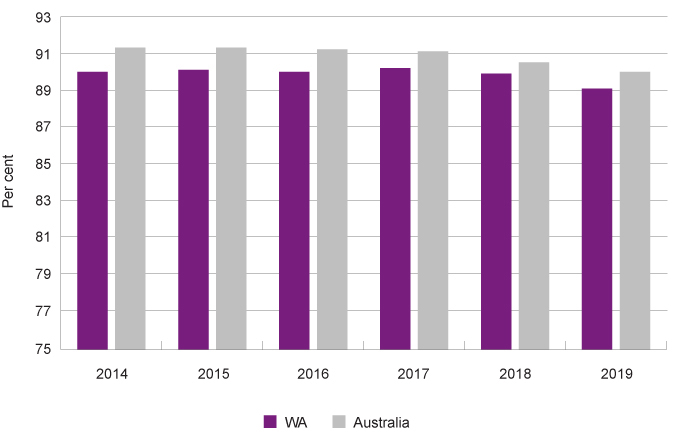
Source: Australian Curriculum and Assessment Reporting Authority, National Report on Schooling 2019 – Student Attendance dataset
There has been a significant improvement in Year 10 to Year 12 retention rates for full-time Aboriginal students from 45.4 per cent in 2012 to 66.0 per cent in 2019.
In the Commissioner’s Speaking Out Survey 2019,5 58.8 per cent of participating students in Years 7 to 12 said attending school every day is ‘very important’ to them and 34.7 per cent reported it is ‘somewhat important’.
Areas of concern
In 2019, only 28.0 per cent of Year 7 to Year 10 Aboriginal students attended for at least 90 per cent of the time (compared to 70.2% of non-Aboriginal students). There has been no improvement in this rate over the last five years.
Year 7 to Year 12 students were significantly less likely than students in Years 4 to 6 to say that being at school every day is very important to them (58.8% compared to 68.4%).
Endnotes
- The Smith Family 2018, Attendance lifts achievement: Building the evidence base to improve student outcomes, March 2018, The Smith Family.
- Hancock KJ et al 2013, Student attendance and educational outcomes: Every day counts, Report for the Department of Education, Employment and Workplace Relations.
- Australian Institute of Health and Welfare 2015, Australia’s welfare 2015, Australia’s Welfare Series No 12, Cat No AUS 189, Australian Institute of Health and Welfare.
- Ryan C 2011, Longitudinal Surveys of Australian Youth, Research Report 56: Year 12 completion and youth transitions, National Centre for Vocational Education Research (NCVER).
- Commissioner for Children and Young People WA 2020, Speaking Out Survey: The views of WA children and young people on their wellbeing - a summary report, Commissioner for Children and Young People WA.
Last updated June 2020
School attendance for students in Years 7 to 10 is collected annually through the data set National Student Attendance Data Collection (ACARA - administrative data). This is across all school sectors and jurisdictions in Australia.
Attendance is commonly reported through two measures, attendance rate1 and attendance level.2 The attendance rate measures the average time students attend school as a proportion of the total number of possible student days. The attendance level records the proportion of students who attend 90 per cent or more of the available days and is therefore useful for identifying the degree of consistent attendance.
In the high school years, the Australian Curriculum, Assessment and Reporting Authority (ACARA) only reports attendance measures for Year 7 to Year 10. For Years 11 and 12 apparent retention rates are reported.
There was little change in the attendance rate for all WA Year 7 to Year 10 students between 2014 and 2018 (89.9% compared to 89.8%), however, in 2019 the rate dropped by almost one percentage point to 89.0 per cent. A similar, however less significant drop was recorded in the national average (from 90.4% in 2018 to 89.9% in 2019).3
The attendance level for WA students in Year 7 to Year 10 also decreased between 2018 and 2019 from 70.7 per cent to 67.2 per cent. The WA attendance level is now below the national level of 68.3 per cent.4
The Department of Education notes that the particularly early and severe flu season impacted attendance data in 2019 and without that attendance rates would have been similar to previous years.
|
Attendance rate |
Attendance level |
|||
|
WA |
Australia |
WA |
Australia |
|
|
2014 |
89.9 |
91.2 |
n/a |
n/a |
|
2015 |
90.0 |
91.2 |
70.5 |
73.9 |
|
2016 |
89.9 |
91.1 |
70.3 |
73.6 |
|
2017 |
90.1 |
91.0 |
71.2 |
73.2 |
|
2018 |
89.8 |
90.4 |
70.7 |
70.0 |
|
2019 |
89.0 |
89.9 |
67.2 |
68.3 |
Source: Australian Curriculum and Assessment Reporting Authority, National Report on Schooling 2019 – Student Attendance dataset
There is little difference in attendance rates and levels between male and female students across the state. Attendance rates and levels generally decrease as students’ distance from the metropolitan area increases.
|
Attendance rate |
Attendance level |
|||
|
Male |
Female |
Male |
Female |
|
|
Metropolitan |
90.2 |
90.3 |
70.1 |
70.8 |
|
Inner regional |
87.7 |
88.4 |
61.9 |
63.8 |
|
Outer regional |
85.9 |
86.6 |
56.8 |
56.8 |
|
Remote |
82.1 |
81.4 |
49.5 |
47.3 |
|
Very remote |
64.5 |
65.3 |
27.8 |
30.9 |
|
All |
88.9 |
89.1 |
66.9 |
67.6 |
Source: Australian Curriculum and Assessment Reporting Authority, National Report on Schooling 2019 – Student Attendance dataset
WA children and young people from low socioeconomic backgrounds, Aboriginal students, students who change schools often and those whose parents have lower levels of education and occupational status, have lower levels of attendance, on average.5 The factors that create these differences in attendance are often in place before children start primary school. Research shows that the gap generally remains constant throughout the school years and that it can widen.6 Refer to the Telethon Kids Institute report, Student attendance and educational outcomes: Every day counts for further information.
Attendance rates for Aboriginal Year 7 to Year 10 students are much lower than for non-Aboriginal students (2019: 68.0% for WA Aboriginal students compared to 90.6% for non-Aboriginal students). Furthermore, the attendance rate for WA Aboriginal students in Year 7 to Year 10 decreased from 69.8 per cent in 2015 to 68.0 per cent in 2019.
|
Attendance rate |
Attendance level |
|||
|
Aboriginal |
Non-Aboriginal |
Aboriginal |
Non-Aboriginal |
|
|
2015 |
69.8 |
91.5 |
29.5 |
73.4 |
|
2016 |
69.2 |
91.4 |
29.6 |
73.2 |
|
2017 |
69.0 |
91.6 |
29.6 |
74.2 |
|
2018 |
68.6 |
91.3 |
30.5 |
73.6 |
|
2019 |
68.0 |
90.6 |
28.0 |
70.2 |
Source: Australian Curriculum and Assessment Reporting Authority, National Report on Schooling 2019 – Student Attendance dataset
There has been no improvement in the proportion of Aboriginal Year 7 to Year 10 students attending at least 90 per cent of the time (attendance level) in WA since 2015 (29.5% in 2015 compared to 28.0% in 2019).
Attendance rates and levels of students in Year 7 to Year 10 by Aboriginal status, per cent, WA, 2015 to 2019
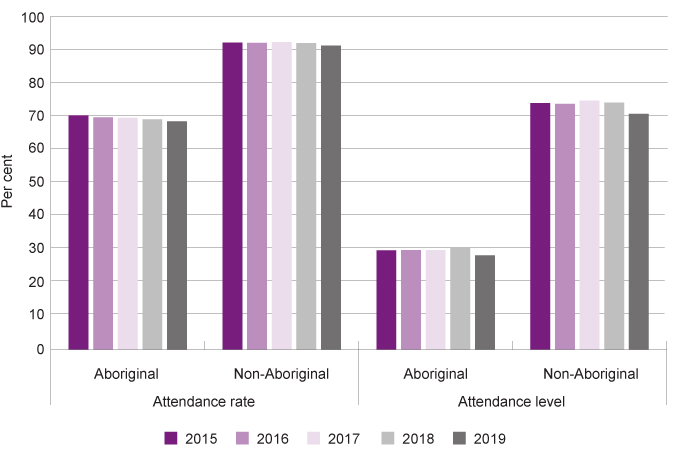
Source: Australian Curriculum and Assessment Reporting Authority, National Report on Schooling 2019 – Student Attendance dataset
The gap between Aboriginal and non-Aboriginal students’ attendance levels generally increases with remoteness. However, the majority of Aboriginal students in the metropolitan area (64.6%) still do not attend at least 90 per cent of the time, which is of significant concern.
|
WA |
Australia |
|||
|
Aboriginal |
Non-Aboriginal |
Aboriginal |
Non-Aboriginal |
|
|
Metropolitan |
35.4 |
71.9 |
42.3 |
72.0 |
|
Inner regional |
34.2 |
64.9 |
42.2 |
65.3 |
|
Outer regional |
27.0 |
61.9 |
39.0 |
64.9 |
|
Remote |
20.8 |
59.2 |
25.3 |
60.0 |
|
Very remote |
12.4 |
56.8 |
12.9 |
57.4 |
|
All |
28.0 |
70.2 |
38.2 |
70.1 |
Source: Australian Curriculum and Assessment Reporting Authority, National Report on Schooling 2019 – Student Attendance dataset
Aboriginal high school students in WA have particularly low attendance rates and levels compared to other Australian jurisdictions. The attendance level of WA Aboriginal students (28.0%) is significantly lower than the attendance level of Aboriginal students nationally (38.2%).
Attendance level for Aboriginal students in Year 7 to Year 10 by remoteness area and Aboriginal status, per cent, WA, 2019
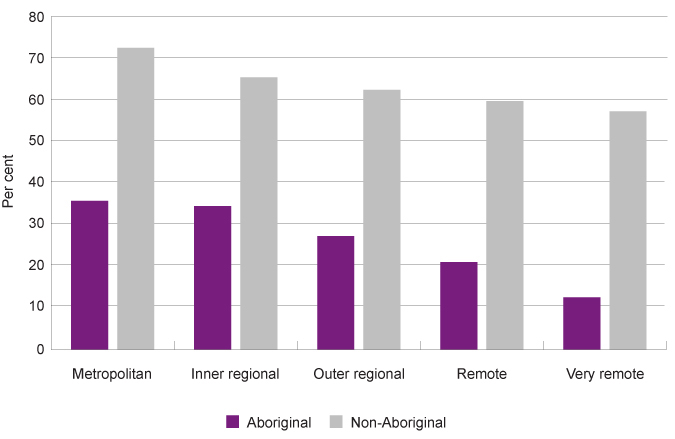
Source: Australian Curriculum and Assessment Reporting Authority, National Report on Schooling 2019 – Student Attendance dataset
These results are partly due to the greater number of Aboriginal students in remote and very remote locations in WA (relative to the non-Aboriginal population). Although, as the table above highlights, significant differences remain between the attendance levels of Aboriginal students in WA across remoteness areas, compared to national results.
Aboriginal students have consistently lower attendance rates and levels in primary school compared to non-Aboriginal students (refer to the School attendance indicator for age group 6 to 11 years), and these differences increase further in high school.
|
Attendance rate |
Attendance level |
|||
|
Aboriginal |
Non-Aboriginal |
Aboriginal |
Non-Aboriginal |
|
|
Year 5 |
79.8 |
93.2 |
41.4 |
78.5 |
|
Year 6 |
80.6 |
93.1 |
44.7 |
78.3 |
|
Year 7 |
75.4 |
92.5 |
34.2 |
76.7 |
|
Year 8 |
69.0 |
90.8 |
28.3 |
70.1 |
|
Year 9 |
64.2 |
89.6 |
24.3 |
66.7 |
|
Year 10 |
61.5 |
89.3 |
24.1 |
66.5 |
Source: Australian Curriculum and Assessment Reporting Authority, National Report on Schooling 2019 – Student Attendance dataset
Attendance rates and levels for Year 5 to Year 10 students by Aboriginal status, per cent, WA, 2019
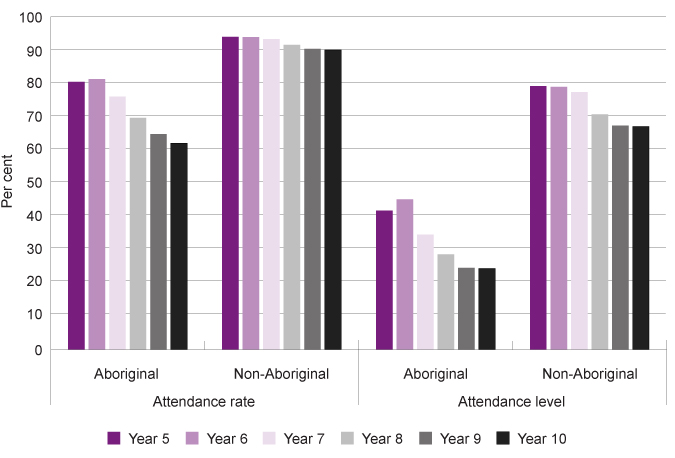
Source: Australian Curriculum and Assessment Reporting Authority, National Report on Schooling 2019 – Student Attendance dataset
In May 2014, the Council of Australian Governments (COAG) agreed to close the gap between Aboriginal and non-Aboriginal school attendance within five years (by 2018). While many Aboriginal students are attending school, the 2020 Closing the Gap report notes that Australia, including WA, did not meet this target.7
For further information refer to the Commissioner's policy brief, Aboriginal Children and Young People’s Education. For further discussion of the issues specifically impacting Aboriginal students’ attendance refer to the Closing the Gap Clearing House report, School attendance and retention of Indigenous Australian students and for additional information on the extent to which multiple disadvantages can impact Aboriginal children and young people refer to the National Centre for Longitudinal Data – Multiple Disadvantage paper.
Children and young people engaging in difficult or challenging behaviour
Research shows that regular attendance at school is critical for children and young people to reach their full potential. However, schools do use suspensions and exclusions when students exhibit certain behaviours. Suspension means the student is temporarily not allowed to come to school and exclusion means a student can no longer attend a particular school, and another school or education program is found for them.
Reasons for suspensions and exclusions can include damage to, or theft of, property, violation of a school’s code of conduct or school/classroom rules as well as physical aggression, and abuse of staff and other students.
|
Number |
Per cent of enrolments |
|
|
2016 |
12,649 |
4.3 |
|
2017 |
14,075 |
4.5 |
|
2018 |
14,243 |
4.5 |
Source: WA Department of Education, Annual Report 2018–19
In 2018, 14,243 primary and high school students (4.5% of total enrolments) were suspended, compared to 14,075 students (also 4.5% of total enrolments) in 2017.
There were 24 exclusions in 2018.8 This represents a substantial increase from 2017 and 2016 when there were eight exclusions in each year.9
Evidence suggests that suspensions can have unintended consequences of further entrenching problematic behaviour, as extended time away from school can result in students falling further behind and becoming even more disengaged.10
Students who are excluded or are otherwise disengaged from mainstream schooling have several alternative education options.
The School of Special Educational Needs: Behaviour and Engagement (SSEN:BE) provides educational support and services for students with extreme, complex and challenging behaviours. The SSEN:BE incorporates the Midland Learning Academy and 13 engagement centres.11 In 2018, 27 severely disengaged students were enrolled at the Midland Learning Academy.12 In 2018, a total of 745 students were supported by the engagement centres across WA.13
Regular attendance is critical for these students, however, due to the complexity of their circumstances, attendance rates for these students are not comparable to other students in WA. The 2018 Annual Report of the SSEN:BE provides further information on these attendance rates.14
Non-government Curriculum and Reengagement in Education (CARE) schools are also available, which cater to young people in secondary school who are marginalised from mainstream education. Approximately 2,100 WA students were enrolled in CARE Schools in Semester 2, 2019.15 Attendance is a key focus for staff at CARE schools as the students enrolled in these schools have often had very low attendance rates in the past. Information on student attendance for each CARE school is generally provided in their performance or annual reports.
Children and young people with medical or mental health issues
For some students, a medical or mental health issue prevents them from successfully participating in mainstream school programs, in this case, the School of Special Educational Needs: Medical and Mental Health (SSEN:MMH) provides educational programs and services. Support is available for both public and private school students and includes educational programs at Perth Children’s Hospital, within the home or to support the transition to the student’s enrolled school. In 2018, the SSEN:MMH had more than 60 programs servicing over 5,565 students.16
Students engaging with SSEN:MMH services generally have lower attendance rates than the broader student population. The attendance rates of students in contact with SSEN:MMH services during only one semester will usually return to pre-contact levels.17 Those students engaged with SSEN:MMH services over multiple semesters, due to more significant medical or mental health issues, will generally continue to have lower attendance rates than the broader student population.18
Children and young people in Banksia Hill Detention Centre
Approximately 134 children and young people aged between 10 and 17 years were held in the Banksia Hill Detention Centre on an average day during 2018–19.19 Education services at Banksia Hill are not managed by the WA Department of Education and attendance rates are not available.
In July 2017, the Office of the Inspector of Custodial Services inspected the Banksia Hill Detention Centre and as part of this inspection, it was found that the education services delivered at Banksia Hill did not meet community standards.20 The Inspector noted that following some critical incidents in May 2017 the education centre was closed and at the time of their review in July 2017 full-time education had not yet been restored. In their review, they noted that based on observation of classrooms and feedback from staff and young people, many students had disengaged from the learning program and were playing card games or doing colouring-in activities during class times.
The Inspector recommended that if significant improvements are not made over the next three years, serious consideration should be given to transferring responsibility for education at Banksia Hill to the Department of Education.21
The Productivity Commission reported that for the 2018–19 year, 97.0 per cent of children and young people of compulsory school age in Banksia Hill were attending an education course. This represents a significant improvement on 2017–18 when only 73.0 per cent of children and young people of compulsory school age were attending an education course.22 This report does not, however, provide information on attendance rates or levels.23
All children have the right to an education. For children and young people held in a detention facility, continuation of their schooling is particularly important as otherwise it will leave them unprepared or even unable to return to school and learning upon release.
Endnotes
- The student attendance rate, KPM 1 (b), is defined as the number of actual full-time equivalent student-days attended by full-time students in Years 1 to 6 as a percentage of the total number of possible student-days that students could have attended over the period.
- The student attendance level, KPM 1(c), is defined as the proportion of full-time students in Years 1-6 whose attendance rate is greater than or equal to 90 per cent over the period of Semester one of the reporting year (from 2015).
- Australian Curriculum, Assessment and Reporting Authority (ACARA) 2017, National Report on Schooling data portal, Student attendance rate by school sector and state/territory for Year 1-10 students.
- Ibid.
- Hancock KJ et al 2013, Student attendance and educational outcomes: Every day counts, Report for the Department of Education, Employment and Workplace Relations.
- Ibid.
- Department of the Prime Minister and Cabinet, Closing the Gap Report 2020, Commonwealth of Australia.
- WA Department of Education 2019, Annual Report 2018–19, WA Government.
- Ibid.
- Office of the Advocate for Children and Young People 2019, What children and young people in juvenile justice centres have to say, NSW Government.
- WA Department of Education, School of Special Educational Needs: Behaviour and Engagement [website].
- WA Department of Education 2019, Annual Report 2018–19, WA Government.
- WA Department of Education 2019, School of Special Educational Needs: Behaviour and Engagement 2018 Annual Report, WA Government.
- Ibid.
- WA Department of Education 2018, Alphabetical List of Australian Schools with enrolment numbers at Semester 2 2019. CARE Schools were identified from a WA Department of Education list of Alternative Education Programs: CARE Schools and a google search.
- WA Department of Education, 2019, School of Special Educational Needs: Medical and Mental Health: 2018 Annual Report.
- WA Department of Education 2018, School of Special Educational Needs: Medical and Mental Health: 2017 Annual Report.
- Ibid.
- WA Department of Justice 2019, Annual Report 2018–19, WA Government, p. 27.
- Office of the Inspector of Custodial Services 2018, 2017 Inspection of Banksia Hill Detention Centre, Government of WA.
- Ibid.
- Productivity Commission 2020, Report on Government Services: Youth Justice, Table 17A.13 Proportion of young people in detention attending education and training, by Indigenous status, Australian Government.
- Data are based on an average of four census dates, one in each term.
Last updated June 2020
Attendance data for Years 11 and 12 are not captured as there are different pathways for students after Year 10. Apparent retention rates provide an indicative measure of the proportion of full-time school students who have stayed at school or equivalent, for a designated year and grade of education.
|
2012 |
2013 |
2014 |
2015 |
2016 |
2017 |
2018 |
2019 |
|
|
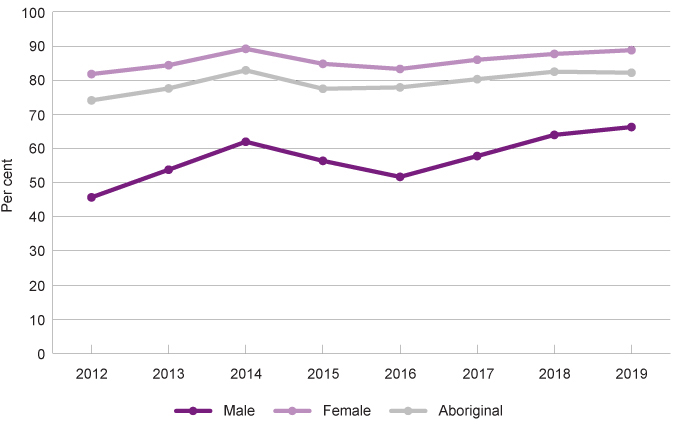
Male |
74.1 |
77.6 |
82.9 |
77.5 |
77.9 |
80.3 |
82.5 |
82.2 |
|
Female |
81.8 |
84.4 |
89.2 |
84.8 |
83.3 |
86.0 |
87.7 |
88.8 |
|
Aboriginal |
45.4 |
53.5 |
61.7 |
56.1 |
51.4 |
57.5 |
63.7 |
66.0 |
|
All |
77.8 |
81.0 |
85.9 |
81.0 |
80.5 |
83.1 |
85.0 |
85.5 |
Source: Australian Bureau of Statistics, 4221.0 Schools, Australia 2019, Table 90a Key Information by States and Territories, 2012-2019
*ABS definition: This provides an indicative measure of the number of school students who have stayed at school for a designated grade and year. It is calculated by dividing the number of students in a cohort in a specific calendar year by the number of students in the same cohort in a previous reference year. It is expressed as a percentage. For example, an ARR for Years 10 to 12 in 2014 would measure the proportion of Year 10 students in 2012 that had continued to Year 12 in 2014.
Apparent Year 10 to Year 12 retention rates of full-time students by gender and Aboriginal status, per cent, WA, 2012 to 2019
Source: Australian Bureau of Statistics, 4221.0 Schools, Australia 2019, Table 90a Key Information by States and Territories
There has been a relatively consistent increase in Year 10 to Year 12 retention rates since 2016 for female, male and Aboriginal students, although in 2019 the retention rates for WA male students declined slightly.
The very high 2014 rates were impacted by high net overseas and interstate migration and more students moving to vocational education and training providers than in previous years. These events were not sustained and the rates returned to levels more consistent with 2013 in 2015, however, have since increased.1
There has been a significant improvement in retention rates for WA Aboriginal students from 45.4 per cent in 2012 to 66.0 per cent in 2019.
Vocational Education and Training (VET) and other Year 12 equivalents
In WA, students are required to remain at school or participate in an approved non‑school option (such as VET or an apprenticeship) until the end of the year they turn 17 years and six months of age, or graduate from high school.
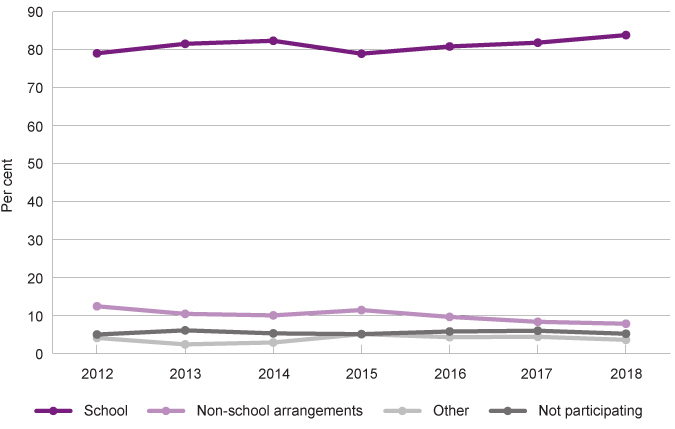
While most young people (83.9% in 2018) are participating in Year 12 at high school (this can include a VET in schools component), some young people aged 16 to 17 years pursue VET outside of the school system.
|
2012 |
2013 |
2014 |
2015 |
2016 |
2017 |
2018 |
|
|
School |
79.1 |
81.6 |
82.4 |
79.0 |
80.9 |
81.9 |
83.9 |
|
Non-school arrangements* |
12.4 |
10.4 |
10.0 |
11.4 |
9.6 |
8.3 |
7.8 |
|
Other** |
3.8 |
2.2 |
2.6 |
4.8 |
4.0 |
4.1 |
3.3 |
|
Not participating*** |
4.7 |
5.8 |
5.0 |
4.8 |
5.5 |
5.7 |
4.9 |
|
Total |
100.0 |
100.0 |
100.0 |
100.0 |
100.0 |
100.0 |
100.0 |
Source: WA School Curriculum and Standards Authority, Annual Reports 2012 to 2018
* Non-school arrangements include TAFE, apprenticeships and employment outside of school.
**Includes students whose whereabouts are unknown, already graduated, left WA or are working with participation teams.
*** Includes students who have left secondary education, not re-registered or are on cancelled or pending notices of arrangements
Student participation in year of turning 17 years of age, per cent, WA, 2012 to 2018
An alternative measure that is commonly reported is the proportion of young people aged 20 to 24 years who have achieved Year 12 or equivalent. While this is not reporting on the current cohort of 16 to 17 year-olds it highlights changes over time.
In 2019, 89.8 per cent of WA 20 to 24 year-olds had a Year 12 or equivalent (Certificate II or above). This has increased from 79.4 per cent in 2010.2
The Year 12 or equivalent attainment rates of WA Aboriginal 20 to 24 year-olds are well below the attainment rates of WA non-Aboriginal young people at 59.9 per cent in 2016, however, have significantly improved from 39.6 per cent in 2006.3
Nevertheless, there remains a significant gap between the Year 12 or equivalent attainment rates of Aboriginal and non-Aboriginal young people, which requires an ongoing focus.
Endnotes
- Western Australian, Department of Education, Annual Report 2017–18, Effectiveness Indicators, p. 97.
- Australian Bureau of Statistics 2019, 6227.0 - Education and Work, May 2019, Table 30 Educational Attainment: Year 12 (or equivalent) or non-school qualification at Certificate Level II or above<persons aged 15-64.
- Department of the Prime Minister and Cabinet 2019, Closing the Gap Prime Minister’s Report 2018, Commonwealth of Australia. Note: The main data source used to assess progress against this target is the ABS Census, it is therefore only measured every five years.
Last updated June 2020
While attendance rates and levels provide an objective measure of school attendance, it is also critical to understand how students view school and their perspectives on the importance of attending school. This represents a valid measure of student’s engagement and their likely participation.
In 2019, the Commissioner for Children and Young People (the Commissioner) conducted the Speaking Out Survey which sought the views of a broadly representative sample of Year 4 to Year 12 students in WA on factors influencing their wellbeing.1 The survey included questions on school attendance.
The majority of students in Years 7 to 12 considered being at school every day to be important – 58.8 per cent reported it was very important and 34.7 per cent said it was somewhat important to them. Around seven per cent of Year 7 to Year 12 students said being at school every day is not very important to them.
Year 7 to Year 12 students were significantly less likely than students in Years 4 to 6 to say that being at school every day is very important to them (58.8% compared to 68.4%).
|
Male |
Female |
Metropolitan |
Regional |
Remote |
Total |
|
|
Very important |
62.7 |
55.2 |
60.0 |
54.0 |
52.9 |
58.8 |
|
Somewhat important |
32.0 |
37.4 |
33.6 |
38.8 |
40.9 |
34.7 |
|
Not important |
5.3 |
7.4 |
6.4 |
7.2 |
6.2 |
6.5 |
Source: Commissioner for Children and Young People WA, Speaking Out Survey 2019 Data Tables [unpublished]
A lower proportion of female students than male students consider regular attendance to be very important (55.2% of female students compared to 62.7% of male students). This represents a change from primary school where 70.9 per cent of female Year 4 to Year 6 students answered that it was very important to them to be at school every day (male Year 4 to Year 6 students: 66.1%). Refer to the School attendance indicator for the 6 to 11 years age group for more information.
In terms of regional differences, metropolitan students were more likely than regional and remote students to say that being at school every day is very important (60.0% compared to 54.0% and 52.9%).
|
Aboriginal |
Non-Aboriginal |
|
|
Very important |
58.4 |
58.8 |
|
Somewhat important |
31.8 |
34.9 |
|
Not very important |
9.7 |
6.3 |
Source: Commissioner for Children and Young People WA, Speaking Out Survey 2019 Data Tables [unpublished]
Equal proportions of Aboriginal and non-Aboriginal students reported that regular attendance is very important but a higher proportion of Aboriginal than non-Aboriginal students reported that this was not very important to them (9.7% compared to 6.3%), however, this difference was not statistically significant.
This finding highlights that Aboriginal students have the same perceptions of the importance of regular attendance at school compared to non-Aboriginal students; however, this is not reflected in the attendance data for the cohort. Aboriginal students attend less often and less regularly than their non-Aboriginal peers and this suggests that there are barriers other than students’ views and perceptions that influence the attendance rates of Aboriginal students.
In the Commissioner’s 2015 consultation with Aboriginal children and young people, participants expressed not only a clear understanding of the connection between a good education and a good quality of life, but also identified barriers to attendance such as family issues, transport or access difficulties and cultural differences.2 Additionally, in a 2010 Wellbeing Survey conducted on behalf of the Commissioner, Aboriginal children and young people in remote areas spoke of the difficulties of attending school due to the loss of family members and attendance at funerals.3
More work is needed to clearly identify the barriers Aboriginal students experience and to design, in a collaborative process with students, strategies that will help them overcome these barriers.
Students in the 2019 Speaking Out Survey were also asked how important their parents or the people who look after them think it is that they go to school every day. In Year 7 to Year 12, 83.6 per cent of students reported it was very important to their parents that they go to school every day. Around two per cent of students responded that it is not very important to their parents.
Female students were less likely than male students to say it was very important to their parents (81.3% compared to 86.5%) and more likely to say that is somewhat important (16.9% compared to 12.0%).4
Aboriginal students in Years 7 to 12 were less likely than non-Aboriginal students to say it was very important to their parents (75.8% compared to 84.1%) that they go to school every day.
Endnotes
- Commissioner for Children and Young People WA 2020, Speaking Out Survey: The views of WA children and young people on their wellbeing - a summary report, Commissioner for Children and Young People WA.
- Commissioner for Children and Young People WA 2015, “Listen To Us”: Using the views of WA Aboriginal and Torres Strait Islander children and young people to improve policy and service delivery, Commissioner for Children and Young People WA.
- Nexus Strategy Solutions, Sankey Associates and Fletcher J 2010, Research Report: Children and Young People’s Views on Wellbeing, for the Commissioner for Children and Young People WA, p. 53.
- Ibid.
Last updated June 2020
At 30 June 2019, there were 2,420 WA young people in care aged between 10 and 17 years, more than one-half of whom (53.3%) were Aboriginal.1
Children and young people in care often face significant barriers to educational attainment and reaching their full potential. However, educational participation and attainment are pivotal to their long-term outcomes.2
Standard 7 of the National Standards for out-of-home care is that children and young people up to at least 18 years are supported to be engaged in appropriate education, training and/or employment. There is, however, no data reported by the Australian Institute of Health and Welfare as part of the National Standards Indicators.
The WA Department of Education has provided attendance rates and levels for all compulsory school-aged WA children and young people in care. While this data is not directly comparable to the ACARA attendance data,3 in 2017, 35.7 per cent of children and young people in care did not attend school more than 90 per cent of the available time.
|
2016 |
2017 |
|
|
Attendance rate |
86.9 |
87.4 |
|
Attendance level |
||
|
90% or greater |
65.7 |
64.3 |
|
80% - <90% |
15.7 |
17.0 |
|
60% - < 80% |
8.8 |
9.8 |
|
<60% |
9.9 |
8.9 |
Source: WA Department of Education Administrative data provided to the Commissioner for Children and Young People WA [unpublished]
Similarly, the WA Department of Communities Outcomes Framework for children in out-of-home care reported that in 2015–16 the attendance level (regularly attending) of all WA students in care attending government schools was 67.1 per cent (58.8% for Aboriginal students and 76.1% for non-Aboriginal students).4 In other words, only around two-thirds of students in care attend for at least 90 per cent of the time. This is markedly lower than the attendance level for all Year 1 to Year 10 students in government schools of 73.7 per cent in 2017.5
There is no data on the apparent retention rates or Year 12 equivalent achievement for WA young people who are, or were in, out-of-home care. A 2009 survey completed by CREATE Foundation found that only 35.3 per cent of Australian care leavers surveyed had completed Year 12.6
In a study commissioned by the Department of Communities, Telethon Kids Institute used linked data to quantify selected outcomes for children and young people who have been in care, and compare these with other children and young people who have been maltreated (but not placed in care) and a control group with similar socio-economic and demographic backgrounds.7 They found that the young people in the control group were three times more likely to achieve the WA Certificate of Education (WACE)8 than the young people in care (46.4% compared to 17.8%) and young people who have been maltreated were also more likely to achieve WACE than those in care (22.5% compared to 17.8%).9
For further information on the attendance and achievement levels of children and young people in care refer:
Tilbury C 2010, Educational status of children and young people in care, Children Australia, Vol 35, No 4.
Endnotes
- Department of Communities 2019, Annual Report: 2018–19, WA Government p. 26.
- Tilbury C 2010, Educational status of children and young people in care, Children Australia, Vol 35, No 4.
- Data provided by the WA Department of Education to the Commissioner, noting the following: children in care are flagged in the Department’s administrative enrolment data, Semester 1 student attendance data is verified by school principals, and the attendance rate is the average half days attended as a percentage of available half days.
- Number of children at compulsory school age who have been in care for the entire reporting period and are regularly attending (90 per cent attendance) an education program, divided by the number of children at compulsory school age who have been in care for the entire reporting period, expressed as a percentage. Source: WA Department for Child Protection and Family Support 2016, Outcomes framework for children in out-of-home care in Western Australia: 2015-2016 Baseline Indicator Report, WA Department for Child Protection and Family Support.
- Australian Curriculum, Assessment and Reporting Authority (ACARA) 2020, Student attendance rate by school sector and state/territory for Year 1-10 students [website].
- McDowall JJ 2009, CREATE Report Card 2009 - Transitioning from care: Tracking progress, CREATE Foundation, p. 55.
- Lima F et al 2018, Exploring outcomes for children who have experienced out-of-home care, Telethon Kids Institute.
- The WACE is a secondary school certificate recognised nationally in the Australian Qualification Framework. It denotes that children meet the standards of senior secondary schooling. Lima F et al (2018), Exploring outcomes for children who have experienced out-of-home care, Telethon Kids Institute, p. 10.
- Lima F et al 2018, Exploring outcomes for children who have experienced out-of-home care, Telethon Kids Institute, p. 27.
Last updated June 2020
The Australian Bureau of Statistics Disability, Ageing and Carers, 2018 data collection reports that approximately 30,200 WA children and young people (9.2%) aged five to 14 years have reported disability.1,2
The UN Convention on the Rights of Persons with Disabilities states that people with disability should be guaranteed the right to inclusive education at all levels, and that children and young people with disability must not be excluded from free and compulsory primary education or secondary education.
Students with disability commonly attend either special schools that enrol only students with special needs, special classes within a mainstream school or mainstream classes within a mainstream school (where students with disability might receive additional assistance).3
In 2018, almost all Australian school children aged five to 14 years with disability attended school (95.8%). Of these, around 70.0 per cent attend mainstream schools, 20.0 per cent attend special classes within a mainstream school and 11.3 per cent attend special schools.4
The Nationally Consistent Collection of Data on School Students with Disability provides a summary of all primary and secondary students receiving an adjustment for disability across Australia.
The data set is designed to collect information on the full range of students receiving adjustments to support their access and participation in learning because of disability, not just those who have a medical diagnosis. The data is collected by teachers using their professional judgement, based on evidence, to classify the adjustment levels.5
Around one in five WA students receive some level of adjustment to access and participate in education.
|
2017 |
2018 |
2019 |
|
|
Support with Quality Differentiated Teaching Practice* |
8.9 |
9.2 |
8.9 |
|
Supplementary** |
8.3 |
7.6 |
7.5 |
|
Substantial*** |
2.5 |
2.3 |
2.4 |
|
Extensive**** |
0.8 |
0.8 |
0.9 |
|
All adjustments |
20.5 |
19.9 |
19.8 |
Source: ACARA, School Students with Disability
Notes: (Source: NCCD Selecting the level of adjustment)
* Students with disability are supported through active monitoring and adjustments that are not greater than those used to meet the needs of diverse learners. These adjustments are provided through usual school processes, without drawing on additional resources.
** Students with disability are provided with adjustments that are supplementary to the strategies and resources already available for all students within the school.
*** Students with disability who have more substantial support needs are provided with essential adjustments and considerable adult assistance.
**** Students with disability and very high support needs are provided with extensive targeted measures and sustained levels of intensive support. These adjustments are highly individualised, comprehensive and ongoing.
Cognitive disability is the most common category of disability for children and young people receiving adjustments at school (58.7% of students receiving adjustments had cognitive disability).
|
2017 |
2018 |
2019 |
|
|
Cognitive |
57.6 |
57.2 |
58.7 |
|
Physical |
24.2 |
22.9 |
20.2 |
|
Sensory |
4.0 |
3.9 |
3.5 |
|
Social-emotional |
14.1 |
16.0 |
17.7 |
|
All |
100.0 |
100.0 |
100.0 |
Source: ACARA, School Students with Disability
Note: If a student has multiple disabilities, teachers and school teams determine which disability category has the greatest impact on the student’s education and is the main driver of adjustments to support the student’s access and participation.
Children and young people with cognitive disability can include those with autism, attention deficit hyperactivity disorder, fetal alcohol spectrum disorder and Down syndrome.
No data exists on school attendance rates or levels for children with disability.
For an overview of school attendance for students with disability, refer to the Australian Institute of Health and Welfare paper, Disability in Australia:changes over time in inclusion and participation in education.
Speaking Out Survey 2019
In 2019, the Commissioner for Children and Young People (the Commissioner) conducted the Speaking Out Survey which sought the views of a broadly representative sample of Year 4 to Year 12 students in WA on factors influencing their wellbeing.6 This survey was conducted across mainstream schools in WA; special schools for students with disability were not included in the sample.
In this survey Year 7 to Year 12 students were asked: Do you have any long-term disability (lasting 6 months or more) (eg sensory impaired hearing, visual impairment, in a wheelchair, learning difficulties)? In total, 315 (11.4%) participating Year 7 to Year 12 students answered yes to this question.
Due to the relatively small sample size, the following results for students who reported long-term disability are observational and not representative of the full population of students with disability in Years 7 to 12 in WA. Comparisons between participating students with and without disability are therefore observational and not statistically significant. Nevertheless, the results provide an indication of the views and experiences of young people with disability.
All students were asked how important it was that they go to school every day: 60.9 per cent of students with disability said it was very important to them to be at school every day, while 30.5 per cent said it was somewhat important. Almost one-in-ten (8.6%) students with disability said it was not very important to them.
These results are broadly similar to the results for students without disability.
|
Students with disability |
Students without disability |
|
|
Very important |
60.9 |
60.2 |
|
Somewhat important |
30.5 |
34.4 |
|
Not very important |
8.6 |
5.5 |
Source: Commissioner for Children and Young People WA, Speaking Out Survey 2019 Data Tables [unpublished]
Students were also asked how important their parents or the people who look after them think it is that they go to school every day. In Year 7 to Year 12, 81.0 per cent of students with disability reported it was very important to their parents that they go to school every day (students without disability: 85.0%).7
Almost one-quarter (23.0%) of students with disability reported having been suspended from school – this proportion was almost double that reported by students without disability (students without disability who had been suspended: 12.7%).8 Research suggests that students with disability, particularly behaviour related disorders such as attention deficit hyperactivity disorder and autism have a higher likelihood of being suspended than students without disability.9,10
More research is required on the school experiences of both students with disability at special schools and students with disability in mainstream schools.
Retention rates
The Australian Bureau of Statistics collects data on the highest year of school completed for people with disability in each jurisdiction. However, this publication reports data for all persons aged 15 years and over.11
In 2013, the Centre for Disability Research and Policy at the University of Sydney analysed the annual survey of Household Income and Labour Dynamics in Australia (HILDA) to determine that the proportion of 20 to 24 year-old Australian young people with disability attaining Year 12 or Certificate II has increased, and the gap between young people with disability and those without decreased on this measure.12
Limited data exists on Year 12 retention rates for WA young people with disability.
Endnotes
- The ABS uses the following definition of disability: ‘In the context of health experience, the International Classification of Functioning, Disability and Health (ICFDH) defines disability as an umbrella term for impairments, activity limitations and participation restrictions… In this survey, a person has a disability if they report they have a limitation, restriction or impairment, which has lasted, or is likely to last, for at least six months and restricts everyday activities.’ Australian Bureau of Statistics 2016, Disability, Ageing and Carers, Australia, 2015, Glossary.
- Australian Bureau of Statistics 2020, Disability, Ageing and Carers, Australia, 2018: Western Australia, Table 1.1 Persons with disability, by age and sex, estimate, and Table 1.3 Persons with disability, by age and sex, proportion of persons.
- Australian Institute of Health and Welfare 2017, Disability in Australia: changes over time in inclusion and participation in education, Cat No DIS 69, AIHW.
- Australian Bureau of Statistics 2019, 4430.0 - Disability, Ageing and Carers, Australia: 2018, Table 7.1 and 7.3: Children aged 5-14 years with disability, living in households, Whether attends school, special school, or special classes by Sex and Severity of disability – 2018, ABS.
- Education Council, Nationally Consistent Collection of Data: School students with disability 2017, 2017 data on students in Australian schools receiving adjustments for disability.
- Commissioner for Children and Young People WA 2020, Speaking Out Survey: The views of WA children and young people on their wellbeing - a summary report, Commissioner for Children and Young People WA.
- Commissioner for Children and Young People WA 2020, Speaking Out Survey 2019 Data Tables, Commissioner for Children and Young People WA [unpublished].
- Ibid.
- Zendarski N et al 2017, Early high school engagement in students with attention/deficit hyperactivity disorder, British Journal of Educational Psychology, Vol 87, No 2.
- Turcotte P et al 2017, School Discipline, Hospitalization, and Police Contact Overlap Among Individuals with Autism Spectrum Disorder, Journal of Autism and Developmental Disorders, Vol 48.
- Australian Bureau of Statistics 2015, 4430.0 - Disability, Ageing and Carers, Australia: Summary of Findings.
- Emerson E et al 2013, Left Behind: 2013, Monitoring the social inclusion of young Australians with self-reported long-term health conditions, impairments or disabilities 2001 – 2011 – Technical Report, Centre for Disability Research and Policy, University of Sydney, p. 16.
Last updated June 2020
Student absences from school are influenced by a combination of home, school and individual factors. However, the relative importance of the various causes is contested. Parents and students tend to highlight school-related factors (for example, poor teaching and failure to engage students); while educators tend to stress parental attitudes and the home environment.1,2
Parents have an important role in encouraging their children to value and enjoy school and learning. There is strong evidence showing that parental expectations and attitudes towards school significantly influence children’s experiences and outcomes.3 Parent participation in school activities such as visiting their children’s class, attending assemblies and parent-teacher nights and volunteering, all provide a mechanism to allow parents to demonstrate their interest in their children’s education.
Families experiencing disadvantage and stress often struggle to engage in this manner, therefore additional services and programs can provide support.4 Research also suggests that ensuring parents are better informed about how poor attendance adversely impacts on their children’s future wellbeing will also improve results.5
Improving the outcomes for disadvantaged students requires multiple approaches with shared responsibility between students, families, schools, communities and a range of government agencies.6
Reasons for Aboriginal student’s non-attendance are complex and can include the lack of recognition by schools of Aboriginal culture and history, the failure to fully recognise that Standard Australian English is not the first language of many Aboriginal students, particularly in remote areas, and the lack of quality engagement with families and communities.7
Schools have a significant role to play in improving attendance levels. A 2010 study found that there were very few high-quality evaluations of programs aimed at improving attendance, therefore evidence about what works is lacking.8 However, there are several indicators that highlight when a child or young person is having difficulty, some of which suggest the following for policy and practice:
- Focus early on students with a high level of unauthorised absences, which are more strongly associated with low achievement, than authorised absences.9
- Provide intensive and early assistance to students who are falling behind in literacy and numeracy so that poor attendees can make progress and those at risk of disengaging are supported.10
- Continue to develop policy and programs that take account of Aboriginal cultures and history, and develop expanded understandings of what it means to participate and engage in education.11
- Develop educational programs in collaboration with parents and community-based organisations.12
- For students with disability, good practice involves moving towards an inclusive education culture through policy and practice, including the development of appropriate support structures and funding regimes, and in-class changes including alternative curricula, individual planning and the use of technologies.13
Data gaps
Data reporting on the attendance rates and levels of students with disability is needed; without this, it is difficult to assess whether children and young people with disability are being provided with consistent and equitable access to education and support and to allow for robust comparison between children and young people with and without disability.
Data on attendance rates and levels of children and young people in out-of-home care and youth detention (Banksia Hill) should also be collected and reported on.
Endnotes
- Purdie N and Buckley S 2010, School attendance and retention of Indigenous Australian students, Issues Paper No 1, produced for the Closing the Gap Clearinghouse, Australian Institute of Health and Welfare and Australian Institute of Family Studies.
- Queensland Department of Education, Training and Employment 2013, Performance insights: School attendance.
- Family-School and Community Partnership Bureau, Fact Sheet: Parent engagement in learning, Australian Government.
- Hancock KJ and Zubrick SR 2015, Children and young people at risk of disengagement from school, prepared by Telethon Kids Institute for the Commissioner for Children and Young People WA.
- Hancock KJ et al 2013, Student attendance and educational outcomes: Every day counts, Report for the Department of Education, Employment and Workplace Relations.
- Ibid.
- Purdie N and Buckley S 2010, School attendance and retention of Indigenous Australian students, Issues Paper No 1 produced for the Closing the Gap Clearinghouse, Australian Institute of Health and Welfare and Australian Institute of Family Studies.
- Ibid.
- Hancock KJ et al 2013, Student attendance and educational outcomes: Every day counts, Report for the Department of Education, Employment and Workplace Relations.
- The Smith Family 2018, Attendance lifts achievement: Building the evidence base to improve student outcomes, March 2018, The Smith Family.
- Purdie N and Buckley S 2010, School attendance and retention of Indigenous Australian students, Issues Paper No 1, produced for the Closing the Gap Clearinghouse, Australian Institute of Health and Welfare and Australian Institute of Family Studies.
- Ibid.
- The Australian Research Alliance for Children and Youth (ARACY) 2013, Inclusive Education for Students with Disability: A review of the best evidence in relation to theory and practice, ARACY.
For more information on school attendance refer to the following resources:
- Cassells R et al 2017, Educate Australia Fair?: Education Inequality in Australia, Focus on the States Series, Issue No 5, Bankwest Curtin Economics Centre.
- Hancock KJ et al 2013, Student attendance and educational outcomes: Every day counts, Report for the Department of Education, Employment and Workplace Relations.
- Hancock KJ and Zubrick SR 2015, Children and young people at risk of disengagement from school, report for Commissioner for Children and Young People, Telethon Kids Institute.
- Purdie N and Buckley S 2010, School attendance and retention of Indigenous Australian students, Issues Paper No 1 produced for the Closing the Gap Clearinghouse, Australian Institute of Health and Welfare and Australian Institute of Family Studies.
- The Smith Family 2018, Attendance lifts achievement: Building the evidence base to improve student outcomes, The Smith Family Research Report.
- Zubrick SR et al 2006, The Western Australian Aboriginal Child Health Survey: Improving the Educational Experiences of Aboriginal Children and Young People, Curtin University of Technology and Telethon Institute for Child Health Research.
For more information on young people’s views on school, see Speaking out about School and Learning.