


Physical health

Physical health is a basic building block for young people’s current wellbeing and future life outcomes. Being physically healthy includes being physically active, having a good diet and being in the healthy weight range.
During adolescence, young people form health-related attitudes and behaviours that can stay with them for life, making it a critical time to support positive and deter negative health practices.1
Last updated August 2021
Some data is available on whether WA young people aged 12 to 17 years are physically healthy.
Overview
This indicator considers some key measures of physical health for young people including physical activity, screen time, diet, weight and long-term health issues.
Physical health is influenced by a range of factors including genetic, social and environmental influences. Research has found that Australian young people living in areas with a high risk of social exclusion1 have, on average, worse health outcomes than young people living in other areas.2 In particular, socio-economic indicators such as having higher income and education levels are linked to better health outcomes.3
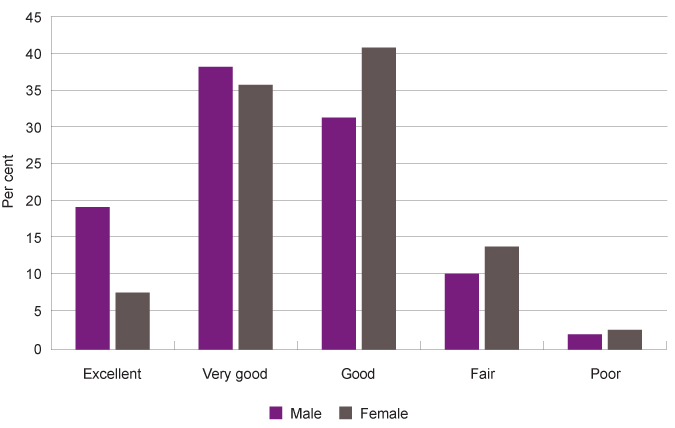
In the Commissioner’s 2019 Speaking Out Survey, one-half of Year 7 to Year 12 students rated their health as excellent or very good (13.5% excellent and 36.3% very good), and another 35.7 per cent rated their health as good.
In 2019, approximately 19.7 per cent of WA young people aged 10 to 15 years were overweight or obese (16.0% overweight), with no significant increase in this proportion since 2012.
There is limited recent data, however the data that is available suggests that Aboriginal young people are more physically active than non-Aboriginal young people in WA.
Areas of concern
Female students in Year 7 to Year 12 were significantly less likely than male students to rate their health as excellent (7.6% compared to 19.1%).
In the 2019 Speaking Out Survey, one-quarter (25.4%) of Year 7 to Year 12 WA students said they hardly ever or never spend time practising or playing a sport outside of school while nine per cent did sport less than once a week.
Female students were less likely than male students to play or practise a sport every or almost every day outside of school (26.0% compared to 35.7%) and were more likely to hardly ever or never play or practise a sport outside of school (28.6% compared to 22.1%).
Consumption of the recommended daily serves of vegetables by young people is very low. In the 2017–18 National Health Survey, only 6.1 per cent of WA young people aged 14 to 17 years were reported as meeting the recommended daily intake of vegetables.
In 2015, 53.1 per cent of children and young people entering out-of-home care had an initial medical examination, even though it is a departmental requirement. No more recent data is available as at publication date.
Endnotes
- In this research social exclusion comprised five domains: socioeconomic circumstances, education, connectedness, housing and health service access.
- Australian Institute of Health and Welfare (AIHW) and National Centre for Social and Economic Modelling (NATSEM) 2014, Child social exclusion and health outcomes: A study of small areas across Australia, Bulletin 121.
- World Health Organisation (WHO) 2008, Closing the gap in a generation: health equity through action on the social determinants of health - Final report of the commission on social determinants of health, WHO.
Last updated August 2021
Being physically healthy is critical for young people’s wellbeing as many health conditions in adulthood have their origins in childhood and adolescence.1 Good health, also influences young people’s engagement with family, community, education and friends.2
Young people aged 12 to 17 years are in a critical phase for establishing positive health behaviours to support their wellbeing over the course of their lifetime.3
In 2019, the Commissioner conducted the Speaking Out Survey (SOS19) which sought the views of a broadly representative sample of 4,912 Year 4 to Year 12 students in WA on factors influencing their wellbeing, including a range of questions on physical health.4
In this survey, one-half (49.8%) of Year 7 to Year 12 students rated their health as excellent or very good (13.5% excellent and 36.3% very good) while 14.5 per cent said their health was only fair or poor (12.0% fair and 2.5% poor).
|
Male |
Female |
Metropolitan |
Regional |
Remote |
All |
|
|
Excellent |
19.1 |
7.6 |
13.6 |
13.3 |
13.3 |
13.5 |
|
Very good |
37.9 |
35.5 |
35.5 |
39.0 |
41.5 |
36.3 |
|
Good |
31.1 |
40.5 |
36.2 |
33.9 |
31.1 |
35.7 |
|
Fair |
10.0 |
13.8 |
12.3 |
11.0 |
11.4 |
12.0 |
|
Poor |
2.0 |
2.6 |
2.4 |
2.8 |
2.7 |
2.5 |
Source: Commissioner for Children and Young People WA 2020, Speaking Out Survey 2019 Data Tables [unpublished]
Female students in Year 7 to Year 12 were significantly less likely than male students to rate their health as excellent (7.6% compared to 19.1%).
Proportion of Year 7 to Year 12 students saying their health is excellent, very good, good, fair or poor by various characteristics, per cent, WA, 2019
Source: Commissioner for Children and Young People WA 2020, Speaking Out Survey 2019 Data Tables [unpublished]
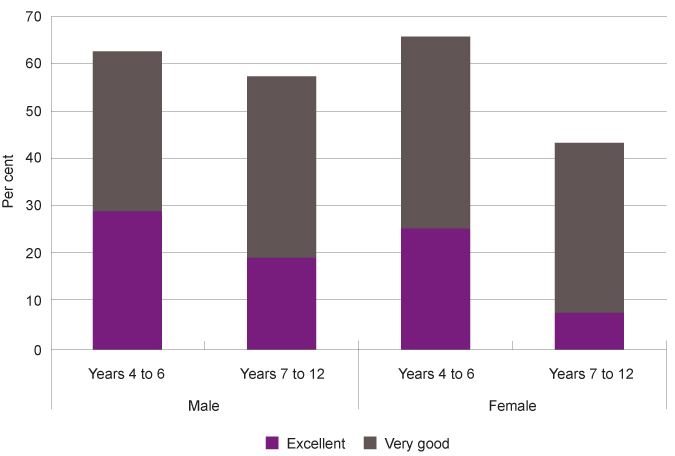
A significantly lower proportion of young people in Year 7 to Year 12 rated their health as excellent or very good (49.8%) compared to children in Year 4 to Year 6 (63.7%). In particular, female Year 7 to Year 12 students were significantly less likely to report that their health was excellent than female Year 4 to Year 6 students (7.6% compared to 25.2%).
|
Male |
Female |
|||
|
Years 4 to 6 |
Years 7 to 12 |
Years 4 to 6 |
Years 7 to 12 |
|
|
Excellent |
28.8 |
19.1 |
25.2 |
7.6 |
|
Very good |
33.4 |
37.9 |
40.1 |
35.5 |
|
Good |
28.7 |
31.1 |
29.0 |
40.5 |
|
Fair |
8.2 |
10.0 |
5.5 |
13.8 |
|
Poor |
0.9 |
2.0 |
N/A |
2.6 |
Source: Commissioner for Children and Young People WA 2020, Speaking Out Survey 2019 Data Tables [unpublished]
Proportion of Year 4 to Year 12 students saying their health is excellent or very good by year group and gender, per cent, WA, 2019
Source: Commissioner for Children and Young People WA 2020, Speaking Out Survey 2019 Data Tables [unpublished]
It is not clear what is contributing to the decline in health ratings from primary school to high school for both female and male students, however the onset of puberty and mental health worries may be a contributing factor. For more information on mental health refer to the Mental health indicator.
There were no significant differences between Aboriginal Year 7 to Year 12 students’ health ratings and non-Aboriginal students’ health ratings. Although, overall a greater proportion of non-Aboriginal students rated their health as excellent or very good than Aboriginal students (Non-Aboriginal: 50.2%, Aboriginal: 43.3%).
|
Aboriginal |
Non-Aboriginal |
|
|
Excellent |
15.2 |
13.4 |
|
Very good |
28.1 |
36.8 |
|
Good |
39.6 |
35.4 |
|
Fair |
13.0 |
12.0 |
|
Poor |
4.1 |
2.4 |
Source: Commissioner for Children and Young People WA 2020, Speaking Out Survey 2019 Data Tables [unpublished]
Having a good nights’ sleep is increasingly being recognised as critical for physical and mental health.5 For physical health, inadequate sleep is associated with a higher risk of young people becoming overweight and having poor overall health.6,7
The recommended hours of sleep is nine to 11 hours for children aged five to 13 years and eight to 10 hours for young people aged 14 to 17 years.8
The Speaking Out Survey asked young people what time they usually went to sleep on a school night and what time they usually woke up on a school day. Less than one-half (44.8%) of young people in Years 12 to 17 went to sleep before 10pm, and 28.5 per cent reported they usually went to sleep later than 11pm.
|
Male |
Female |
Metropolitan |
Regional |
Remote |
All |
|
|
Before 9pm |
17.9 |
14.1 |
14.8 |
17.1 |
29.9 |
15.9 |
|
9 to 9:59pm |
29.5 |
28.4 |
29.3 |
26.6 |
28.7 |
28.9 |
|
10 to 10:59pm |
26.2 |
27.6 |
26.1 |
31.9 |
21.3 |
26.7 |
|
11pm to midnight |
16.6 |
20.8 |
19.7 |
15.4 |
13.8 |
18.8 |
|
After midnight |
9.8 |
9.1 |
10.1 |
8.9 |
6.4 |
9.7 |
Source: Commissioner for Children and Young People WA 2020, Speaking Out Survey 2019 Data Tables [unpublished]
A greater proportion of male young people went to sleep before 10pm than female young people (male: 47.4%, female: 42.5%).
A significantly greater proportion (29.9%) of young people in remote locations went to sleep before 9pm than regional (17.1%) and metropolitan (14.8%) young people.
Students in Years 10 to 12 were most likely to say they go to sleep later than 11pm (11pm to midnight: 26.9% and after midnight: 12.9%).
|
Year 7 to 9 |
Year 10 to 12 |
|
|
Before 9pm |
25.1 |
5.5 |
|
9 to 9:59pm |
36.7 |
20.0 |
|
10 to 10:59pm |
19.5 |
34.8 |
|
11pm to midnight |
11.6 |
26.9 |
|
After midnight |
6.9 |
12.9 |
Source: Commissioner for Children and Young People WA 2020, Speaking Out Survey 2019 Data Tables [unpublished]
At the same time, 94.9 per cent of Year 10 to Year 12 students reported waking up before 8am, which suggests that many Year 10 to Year 12 students are not getting enough sleep.9
Analysis of the Speaking Out Survey results shows that sleeping fewer hours each night is associated with lower happiness, life satisfaction, resilience and prolonged sadness, especially for students sleeping fewer than seven hours.10
Recent research based on the Longitudinal study of Australian Children found that 27.0 per cent of 12 to 13 year-olds, 26.0 per cent of 14 to 15 year-olds and 52.0 per cent of 16 to 17 year-olds are not meeting the minimum sleep guidelines.11
This study concluded that young people who were not meeting the minimum guidelines for sleep were more likely to have poor mental health, be late or absent from school, spend more time on homework and more time on the internet.12
Endnotes
- Australian Institute of Health and Welfare (AIHW) 2011, Young Australians: their health and wellbeing 2011, AIHW, p. 1.
- Australian Institute of Health and Welfare (AIHW) 2020, Australia’s Children, AIHW, p. 30.
- Australian Institute of Health and Welfare (AIHW) 2011, Young Australians: their health and wellbeing 2011, AIHW, p. 1.
- Commissioner for Children and Young People WA 2020, Speaking Out Survey: The views of WA children and young people on their wellbeing - a summary report, Commissioner for Children and Young People WA.
- Evans-Whipp T & Gasser C 2019, Are children and adolescents getting enough sleep? In LSAC Annual Statistical Report 2018, Australian Institute of Family Studies, p. 29.
- Landhuis CE et al 2008, Childhood sleep time and long-term risk for obesity: A 32-year prospective birth cohort study, Pediatrics, Vol 122, No 5.
- Chaput J et al 2016, Systematic review of the relationships between sleep duration and health indicators in school-aged children and youth, Applied physiology, nutrition and metabolism, Vol 41 (6 Suppl 3).
- Department of Health 2020, Australian 24-Hour Movement Guidelines for Children and Young People (5-17 years) – An Integration of Physical Activity, Sedentary Behaviour and Sleep, Australian Government.
- Commissioner for Children and Young People WA 2020, Speaking Out Survey: The views of WA children and young people on their wellbeing - a summary report, Commissioner for Children and Young People WA, p. 34.
- Commissioner for Children and Young People WA 2020, Speaking Out Survey 2019 Data Tables, Commissioner for Children and Young People WA [unpublished].
- Evans-Whipp T & Gasser C 2019, Are children and adolescents getting enough sleep? In LSAC Annual Statistical Report 2018, Australian Institute of Family Studies, p. 35.
- Ibid, p. 29.
Last updated August 2021
Physical activity makes an important positive contribution to the health and wellbeing of young people. Doing regular moderate and/or vigorous physical activity supports the development of healthy bones, muscles, joints and a healthy cardiovascular system. It is also an important element to achieving and maintaining a healthy weight. Physical inactivity is strongly associated with obesity which is a major risk factor for chronic disease.1
Physical activity also enhances cognitive functioning including memory, concentration and the ability to learn.2 Furthermore, it is associated with social and emotional benefits including improved mental health and self-esteem.3
The current recommendation for physical activity is that children and young people aged five to 17 years should do at least 60 minutes of moderate to vigorous intensity physical activity every day, and at least 3 days per week where these activities strengthen muscle and bone.4
Data collected on the physical activity of young people is often survey-based information, either self-reported daily physical activity or parent-reported daily physical activity. This measure reports data from three key data sources:
- The Commissioner’s 2019 Speaking Out Survey (SOS19)
- WA Department of Health, Health and Wellbeing Surveillance System
- Australian Bureau of Statistics, National Health Survey
In 2019, the Commissioner conducted SOS19 which sought the views of a broadly representative sample of 4,912 Year 4 to Year 12 students in WA on factors influencing their wellbeing, including a range of questions on physical health.5
Overall, 50.8 per cent of young people in Year 7 to Year 12 reported they cared very much about staying fit and being physically active, while 35.1 per cent cared some. Almost 15 per cent of students cared a little (11.6%) or not at all (2.5%).
|
Male |
Female |
Metropolitan |
Regional |
Remote |
All |
|
|
Very much |
56.0 |
46.1 |
51.1 |
48.3 |
53.3 |
50.8 |
|
Some |
31.4 |
38.7 |
35.4 |
32.3 |
36.9 |
35.1 |
|
A little |
9.8 |
13.6 |
11.3 |
14.5 |
8.1 |
11.6 |
|
Not at all |
2.8 |
1.5 |
2.1 |
4.8 |
1.7 |
2.5 |
Source: Commissioner for Children and Young People WA 2020, Speaking Out Survey 2019 Data Tables [unpublished]
Female Year 7 to Year 12 students were significantly less likely to care very much about being physically active than male students (46.1% compared to 56.0%).
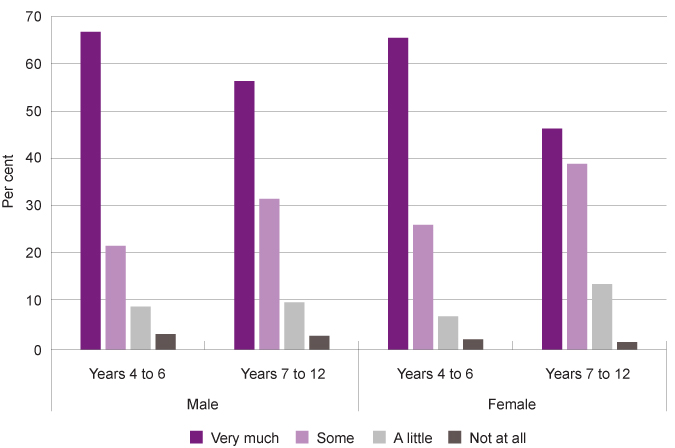
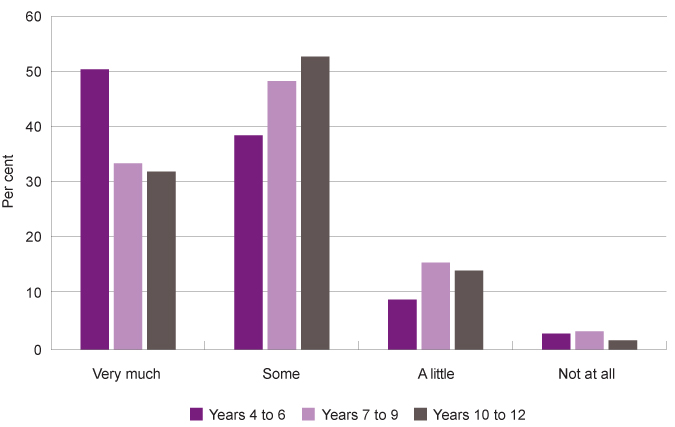
High school students were much less likely than Year 4 to Year 6 primary school students to report they cared very much about staying fit and physically active (50.8% compared to 66.0%).
|
Years 4 to 6 |
Years 7 to 12 |
|||||
|
Male |
Female |
All |
Male |
Female |
All |
|
|
Very much |
66.3 |
65.0 |
66.0 |
56.0 |
46.1 |
50.8 |
|
Some |
21.6 |
26.0 |
23.6 |
31.4 |
38.7 |
35.1 |
|
A little |
8.9 |
6.9 |
7.8 |
9.8 |
13.6 |
11.6 |
|
Not at all |
3.2 |
2.1 |
2.6 |
2.8 |
1.5 |
2.5 |
Source: Commissioner for Children and Young People WA 2020, Speaking Out Survey 2019 Data Tables [unpublished]
Proportion of students reporting they care about staying fit or physically active very much, some, a little or not at all by year group and gender, per cent, WA, 2019
Source: Commissioner for Children and Young People WA 2020, Speaking Out Survey 2019 Data Tables [unpublished]
In particular, female students in primary school were significantly more likely than female students in high school to report they cared very much about staying fit and physically active (65.0% compared to 46.1%).
It should be noted that this data is from different cohorts of students in primary school and high school. Younger children may be influenced by more public awareness of the importance of physical activity through increased public health messaging and advertising. Results from future Speaking Out Surveys will show changes over time and determine whether the current primary school cohort continue to care more about staying fit and physically active as they move into high school – or if the transition into high school and through adolescence changes students’ views.
There were no significant differences in responses regarding caring about staying fit or physically active between Year 7 to Year 12 students in metropolitan, regional and remote locations.
Students participating in SOS19 were also asked how often they usually spend time practising or playing a sport (like footy training, gymnastics, swimming) outside of school.
One-quarter (25.4%) of Year 7 to Year 12 students said they hardly ever or never spend time practising or playing a sport outside of school and nine per cent did sport less than once a week. Almost one-third (30.9%) said they spend time practising or playing a sport every day or almost every day outside of school, while a similar proportion (31.3%) said they do this once or twice a week.
|
Male |
Female |
Metropolitan |
Regional |
Remote |
All |
|
|
Every day or almost every day |
35.7 |
26.0 |
30.7 |
28.6 |
39.9 |
30.9 |
|
Once or twice a week |
31.8 |
30.9 |
30.5 |
35.3 |
33.1 |
31.3 |
|
Less than once a week |
7.1 |
11.1 |
9.3 |
8.8 |
3.5 |
9.0 |
|
Hardly ever or never |
22.1 |
28.6 |
26.1 |
23.3 |
19.5 |
25.4 |
|
I don't know |
3.4 |
3.4 |
3.3 |
4.0 |
4.1 |
3.4 |
Source: Commissioner for Children and Young People WA 2020, Speaking Out Survey 2019 Data Tables [unpublished]
Young people in remote locations were more likely to play or practise a sport outside of school every day or almost every day than young people in the metropolitan or regional areas (39.9% compared to 30.7% and 28.6% respectively).
Female students were less likely than male students to play or practise a sport every or almost every day outside of school (26.0% compared to 35.7%) and more likely to hardly ever or never play or practise a sport outside of school (28.6% compared to 22.1%).
These results are consistent with other research reporting that male children and young people are more likely to do more physical activity than female children and young people.6,7
Further analysis of the SOS19 data shows that there is a statistically significant relationship between young people caring a lot about staying fit and being physically active and the time they spend practising or playing a sport outside of school. The data also shows that Year 9 to Year 12 students who hardly ever or never played or practised a sport outside of school were more likely feel sad, blue or depressed for more than two weeks in a row. This was particularly the case for female students.8
The WA Department of Health administers the Health and Wellbeing Surveillance System to monitor the health of WA’s general population, which includes interviewing WA parents and carers about the health of their children aged 0 to 15 years.9 Young people aged 16 years and over are included in the adult survey, with no disaggregation by age to report on young people separately.
In this survey, parents and carers are asked about their children’s activity levels and based on these responses, the Department of Health determines the proportion of WA young people meeting the physical activity guidelines.
Research shows that while parent-reported data on physical activity for children is valid, it has limitations depending on the questions asked (e.g. difficulty estimating unstructured activities).10
From 2012 to 2019, there was a decline in young people aged 10 to 15 years being assessed as meeting the recommended activity level (from 47.5% to 30.7%). Furthermore, the proportion of young people that have been assessed by their parent/carer to be completing no physical activity increased to over 10 per cent (11.2%) in 2018 and is just under 10 per cent (9.9%) in 2019.
|
No activity |
1 to 6 sessions |
7 or more |
7 or more sessions |
|
|
2012 |
6.2 |
35.9 |
10.4 |
47.5 |
|
2013 |
6.8* |
39.4 |
14.3 |
39.5 |
|
2014 |
4.1* |
42.5 |
13.2 |
40.3 |
|
2015 |
5.6* |
38.9 |
16.4 |
39.2 |
|
2016 |
5.5* |
40.2 |
17.8 |
36.5 |
|
2017 |
5.7* |
50.1 |
11.3 |
32.9 |
|
2018 |
11.2 |
38.9 |
15.3 |
34.5 |
|
2019 |
9.9 |
37.6 |
21.8 |
30.7 |
Source: Dombrovskaya M et al 2020, Health and Wellbeing of Children in Western Australia in 2019, Overview and Trends, WA Department of Health (and previous years’ reports)11
* Prevalence estimate has a relative standard error of 25 per cent to 50 per cent and should be used with caution.
** Meets the recommendation for vigorous physical activity, not the recommendation regarding strength-based exercise.
Research that shows that physical activity decreases as children and young people age and move through adolescence.12,13 Supporting this, the Australian Bureau of Statistics 2017–18 National Health Survey,14 reports that only 1.9 per cent of Australian 15 to 17-year-olds met both the physical activity and muscle strengthening aspects of the guidelines.15 Furthermore, over one-third (39.9%) of 15 to 17 year-olds did not do any physical activity for at least 60 minutes in the last week.16
Data for WA young people is published for this survey, however, has a very high margin of error and has not been reported here.
Consistent with SOS19, the WA Health and Wellbeing Surveillance System reports that a higher proportion of male children and young people than female children and young people generally meet the recommended activity level.17
|
Male |
Female |
|
|
2012 |
55.0 |
42.7 |
|
2013 |
49.1 |
33.6 |
|
2014 |
39.8 |
40.3 |
|
2015 |
48.5 |
28.0 |
|
2016 |
39.9 |
39.5 |
|
2017 |
46.2 |
32.5 |
|
2018 |
45.4 |
34.5 |
|
2019 |
45.2 |
32.3 |
Source: Dombrovskaya M et al 2020, Health and Wellbeing of Children in Western Australia in 2019, Overview and Trends, WA Department of Health (and previous years’ reports)18
Similarly, the 2017–18 National Health Survey,19 found that two-thirds (64.5%) of female Australian young people aged 15 to 17 years did less than 300 minutes (5 hours) of exercise per week, compared to 40.0 per cent of male young people.20
|
Male |
Female |
|
|
0 minutes |
9.1 |
11.9 |
|
Between 1 and 149 minutes |
14.0 |
30.6 |
|
Between 150 and 300 minutes |
16.9 |
22.0 |
|
More than 300 minutes |
59.5 |
35.5 |
|
Total 150 minutes or more |
77.2 |
56.9 |
|
Total |
100.0 |
100.0 |
Source: ABS, National Health Survey: First Results, 2017–18, Table 13.7 Physical activity, Proportion of persons – Males and Table 13.11 Physical activity, Proportion of persons - Females
In 2008, researchers from Edith Cowan University and the University of Western Australia conducted the Child and Adolescent Physical Activity and Nutrition Survey (CAPANS) in WA and found significant differences between male and female respondents. In this study, participants wore pedometers and completed exercise diaries. While only 37.6 per cent of male secondary school students reported activity that met the recommended guidelines, even fewer female secondary school students (10.1%) reported activity that met the recommended guidelines.21This survey has not been repeated.
The Sport Australia AusPlay survey is a large scale national survey to track sporting behaviours and activities of the Australian population. In this survey, young women and adult women (15 years and over) were more likely than young men/adult men to take part in non-sport related activities such as gym and fitness or walking.22
Aboriginal young people
There is limited regularly reported data on the physical activity of WA Aboriginal young people or young people in metropolitan, regional and remote locations. The WA Health and Wellbeing Surveillance System does not provide disaggregated information on physical activity for Aboriginal children or by geographic location.
In SOS19, Aboriginal Year 7 to Year 12 students had similar responses to non-Aboriginal students regarding how much they cared about staying fit or physically active (Aboriginal: 52.9% cared very much, non-Aboriginal 50.7% cared very much).
|
Aboriginal |
Non-Aboriginal |
|
|
Very much |
52.9 |
50.7 |
|
Some |
32.7 |
35.2 |
|
A little |
11.2 |
11.7 |
|
Not at all |
3.2 |
2.4 |
Source: Commissioner for Children and Young People WA 2020, Speaking Out Survey 2019 Data Tables [unpublished]
However, Aboriginal Year 7 to Year 12 students were generally more likely than non-Aboriginal students to play or practise sport every day (36.7% compared to 30.5%).
|
Aboriginal |
Non-Aboriginal |
|
|
Every day or almost every day |
36.7 |
30.5 |
|
Once or twice a week |
27.6 |
31.6 |
|
Less than once a week |
7.4 |
9.1 |
|
Hardly ever or never |
21.2 |
25.6 |
|
I don't know |
7.1 |
3.2 |
Source: Commissioner for Children and Young People WA 2020, Speaking Out Survey 2019 Data Tables [unpublished]
This is consistent with other data that suggests WA Aboriginal children and young people are more physically active than non-Aboriginal children and young people in WA.
In 2012–13, the Australian Bureau of Statistics (ABS) conducted the Australian Aboriginal and Torres Strait Islander Health Survey: Physical activity. They reported that a higher proportion of WA Aboriginal children and young people (45.6%) aged five to 17 years in non-remote areas met the physical activity recommendation compared with non-Aboriginal children and young people (40.5%).23
More recent data from the 2018–19 National Aboriginal and Torres Strait Islander Health Survey found that only 4.8 per cent of Aboriginal WA young people aged 15 to 17 years meet the physical activity guidelines.24
More data is needed on the level of physical activity of Aboriginal young people across WA.
A 2018 report (based on the AusPlay survey data from that year) found that Australian children are less likely to participate in organised physical activity outside school hours if:
- they come from a low-income family
- they live in a remote or regional area
- a parent speaks a Language Other Than English (LOTE) at home
- they have three or more siblings.25
The survey also found that only 58 per cent of children and young people from low-income families participate in organised physical activity outside of school compared to 73 per cent of young people from middle income families and 84 per cent of young people from high income families.26
The WA Government provides financial assistance to encourage WA children and young people to engage in sporting activities through the KidSport program. The program provides up to $150 per year towards fees for approved sporting clubs for children and young people aged five to 18 years from low income families.
The 2019–20 Annual Report of the Department of Local Government, Sport and Cultural Industries stated that in 2019–20, 18,596 KidSport vouchers were provided to WA children and young people, including 2,300 Aboriginal applicants, 1,000 from the CALD community and 1,200 children with a disability.27
The report noted that restrictions on community sport between March and June 2020 due to COVID-19 had impacted the number of vouchers issued, but that they were experiencing a significant increase in the number of applications with the resumption of community sport in early 2020/21.28
No data has been publicly reported on whether eligible children and young people have increased their physical activity as a result of the program.
Endnotes
- Australian Institute of Health and Welfare (AIHW) 2018, Physical activity across the life stages, Cat No PHE 225, AIHW.
- WA Department of Sport and Recreation 2015, Brain Boost: how sport and physical activity enhance children’s learning, Centre for Sport and Recreation Research, Curtin University.
- Australian Institute of Health and Welfare (AIHW) 2018, Physical activity across the life stages, Cat No PHE 225, AIHW, p. 1.
- Department of Health, Australia's Physical Activity and Sedentary Behaviour Guidelines and the Australian 24-Hour Movement Guidelines, Australian Government [website].
- Commissioner for Children and Young People WA 2020, Speaking Out Survey: The views of WA children and young people on their wellbeing - a summary report, Commissioner for Children and Young People WA.
- Martin K et al 2008, Move and Munch Final Report: Trends in physical activity, nutrition and body size in Western Australian children and adolescents: the Child and Adolescent Physical Activity and Nutrition Survey (CAPANS), Department of Sports and Recreation, WA Government.
- Telford RM et al 2016, Why Are Girls Less Physically Active than Boys? Findings from the LOOK Longitudinal Study, PloS one, Vol 11 No 3.
- Commissioner for Children and Young People WA 2020, Data Insights: Female students’ views on their wellbeing, Commissioner for Children and Young People WA.
- The WA Department of Health’s, Health and Wellbeing Surveillance System is a continuous data collection which was initiated in 2002 to monitor the health status of the general population. In 2019, 546 parents/carers of children aged 0 to 15 years were randomly sampled and completed a computer assisted telephone interview between January and December, reflecting an average participation rate of just over 90 per cent. The sample was then weighted to reflect the WA child population.
- Bauman A et al 2019, Physical activity measures for children and adolescents - recommendations on population surveillance: an evidence check rapid review, Sax Institute, p. 14.
- This data has been sourced from individual annual Health and Wellbeing Surveillance System reports and therefore has not been adjusted for changes in the age and sex structure of the population across these years nor any change in the way the question was asked. No modelling or analysis has been carried out to determine if there is a trend component to the data, therefore any observations made are only descriptive and are not statistical inferences.
- Australian Institute of Health and Welfare (AIHW) 2018, Physical activity across the life stages, Cat No PHE 225, AIHW, p. vii.
- Victorian Department of Health 2018, Teens and sport: What the research shows, Victorian Government.
- In most cases, the responses for young people aged 15 to 17 years-old were by an adult nominated by the household. Some young people aged 15-17 years may have been personally interviewed with parental consent. Source: ABS, National Health Survey: 2017–18, Explanatory Notes, ABS.
- Australian Bureau of Statistics 2020, National Health Survey: First Results, 2017–18, Table 13.3, 13.7, 13.11 Physical activity, ABS.
- Australian Bureau of Statistics 2020, National Health Survey: First Results, 2017–18, Table 13.3 Physical activity, ABS.
- This data has been sourced from individual annual Health and Wellbeing Surveillance System reports and therefore has not been adjusted for changes in the age and sex structure of the population across these years nor any change in the way the question was asked. No modelling or analysis has been carried out to determine if there is a trend component to the data, therefore any observations made are only descriptive and are not statistical inferences.
- This data has been sourced from individual annual Health and Wellbeing Surveillance System reports and therefore has not been adjusted for changes in the age and sex structure of the population across these years nor any change in the way the question was asked. No modelling or analysis has been carried out to determine if there is a trend component to the data, therefore any observations made are only descriptive and are not statistical inferences.
- This release of the Australian Health Survey incorporated the National Nutrition and Physical Activity Survey (NNPAS) This included detailed adult and child physical activity results derived from self-reported and pedometer collection methods. Source: Australian Bureau of Statistics, Australian Health Survey: Physical Activity, 2011–12 Explanatory Notes.
- Australian Bureau of Statistics 2020, National Health Survey: First Results, 2017–18, Table 13.3, 13.7, 13.11 Physical activity, ABS.
- Australian Sports Commission 2017, AusPlay Focus: Women and Girls Participation, Australian Government, p. 7.
- Australian Bureau of Statistics, 4727.0.55.004 - Australian Aboriginal and Torres Strait Islander Health Survey: Physical activity, 2012–13, Table 9.3 Whether met physical and screen-based activity recommendations by Indigenous status by selected characteristics, Children aged 5–17 years in non-remote areas (proportion).
- Australian Bureau of Statistics 2020, National Aboriginal and Torres Strait Islander Health Survey, Australia, 2018–19, Table 21.3 Physical activity, by age and sex, Aboriginal and Torres Strait Islander persons in non-remote areas aged 15 years and over, 2018–19, ABS.
- Australian Sports Commission 2018, AusPlay Focus: Children’s Participation in Organised Physical Activity Outside of School Hours, Australian Government, p. 12.
- Australian Sports Commission 2018, AusPlay Focus: Children’s Participation in Organised Physical Activity Outside of School Hours, Australian Government. In this report, low income families were defined as those with gross (before tax) household income of less than $55,000 per annum; middle income families were defined as those with gross (before tax) household income between $55,000 and $174,999 per annum; and high income families are those with gross (before tax) household income of $175,000 or more per annum.
- Department of Local Government, Sport and Cultural Industries 2020, Annual Report: 2019–20, WA Government, p. 95
- Ibid.
Last updated August 2021
Over the past decade, it has been increasingly recognised that while media devices provide significant opportunities for learning and development, high levels of screen-based activities can be detrimental to young people’s health and wellbeing.1 In particular, a high level of screen time is associated with sedentary behaviour, low quality sleep, obesity and for some eye health issues.2,3,4,5 Although evidence is mixed, screen time is increasingly associated with mental health issues for young people, including anxiety and depression.6,7
Screen time is therefore important for young people’s wellbeing as a measure of how much time is spent in sedentary activities (not being physically active) and how much time is spent on interacting and managing social media, which may impact their mental health and self-esteem and disrupt healthy sleep patterns.
The Australian Guidelines for Healthy Growth and Development for Children and Young People (5 to 17 years) recommend that the use of electronic media for entertainment should be limited to a maximum of two hours per day and long periods of sitting should be broken up as often as possible.
The guidelines are principally focused on reducing sedentary behaviour – based on the theory that more hours spent viewing a screen means less physical exercise. Although it should be noted that screen time does not report on overall levels of sedentary behaviour, which can include other activities such as reading, sitting or lying down.8
Young people now grow up with screens as an integral part of their education and social development, and as more young people have access to mobile devices it is increasingly difficult to measure daily screen time.
Due to this shift, it is more critical to focus on the quality of the content being consumed rather than a simple focus on the number of hours of screen time. It is also essential to ensure young people do enough physical activity and get high quality sleep.
In 2019, the Commissioner conducted the Speaking Out Survey (SOS19) which sought the views of a broadly representative sample of 4,912 Year 4 to Year 12 students in WA on factors influencing their wellbeing, including a range of questions on access and use of technology.9
While the survey did not ask about the number of hours of daily usage, it is evident from the data that young people use screens on a daily basis for a range of activities and it is likely many do not meet the screen time guidelines given they use screens for entertainment, socialising, communicating, gaming and for educational purposes.
Overall, 86.8 per cent of young people in Year 7 to Year 12 reported they usually spend time using the internet on a smartphone or computer when they are not at school every day or almost every day.
|
Male |
Female |
Metropolitan |
Regional |
Remote |
All |
|
|
Every day or almost every day |
84.8 |
88.9 |
87.9 |
84.3 |
76.3 |
86.8 |
|
Once or twice a week |
9.5 |
6.2 |
7.6 |
7.9 |
12.0 |
7.9 |
|
Less than once a week |
2.6 |
2.2 |
2.1 |
3.0 |
4.3 |
2.4 |
|
Hardly ever or never |
2.1 |
1.8 |
1.5 |
3.2 |
5.7 |
2.0 |
|
I don't know |
1.0 |
0.9 |
0.8 |
1.5 |
N/A |
1.0 |
Source: Commissioner for Children and Young People WA 2020, Speaking Out Survey 2019 Data Tables [unpublished]
A significantly lower proportion of young people in remote locations than metropolitan locations spent time every day or almost every day using the internet (76.3% compared to 87.9%).
Young people in Year 7 to Year 9 were less likely than those in Year 10 to Year 12 to use the internet every day or almost every day (81.1% compared to 93.2%).
|
Years 7 to 9 |
Years 10 to 12 |
|
|
Every day or almost every day |
81.1 |
93.2 |
|
Once or twice a week |
11.2 |
4.2 |
|
Less than once a week |
3.4 |
1.3 |
|
Hardly ever or never |
2.9 |
0.9 |
|
I don't know |
1.4 |
0.5 |
Source: Commissioner for Children and Young People WA 2020, Speaking Out Survey 2019 Data Tables [unpublished]
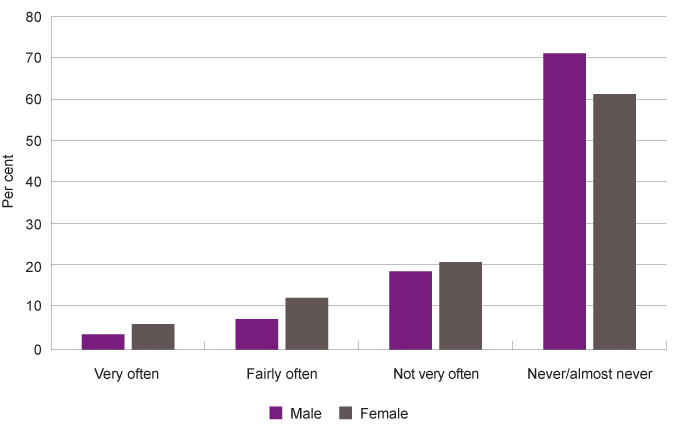
Young people were asked how often they go without eating or sleeping because of their mobile phone. Two-thirds (65.6%) of young people in Year 7 to Year 12 reported that they never or almost never go without eating or sleeping because of their mobile phone. One in five (19.6%) reported they do so not very often, while 10.0 per cent reported they fairly often go without eating or sleeping because of their mobile phone and 4.8 per cent do so very often.
|
Male |
Female |
Metropolitan |
Regional |
Remote |
All |
|
|
Very often |
3.6 |
6.0 |
4.5 |
5.2 |
8.5 |
4.8 |
|
Fairly often |
7.2 |
12.3 |
10.6 |
6.2 |
10.0 |
10.0 |
|
Not very often |
18.6 |
20.8 |
19.8 |
20.8 |
13.4 |
19.6 |
|
Never/almost never |
70.6 |
60.9 |
65.1 |
67.8 |
68.1 |
65.6 |
Source: Commissioner for Children and Young People WA 2020, Speaking Out Survey 2019 Data Tables [unpublished]
Female young people are more likely than their male peers to very often or fairly often go without eating or sleeping because of their mobile phone (very often: 6.0% compared to 3.6%; fairly often: 12.3% compared to 7.2%).
Proportion of Year 7 to Year 12 students reporting how often they go without eating or sleeping because of their mobile phone by gender, per cent, WA, 2019
Source: Commissioner for Children and Young People WA 2020, Speaking Out Survey 2019 Data Tables [unpublished]
Further analysis of the Speaking Out Survey data shows that there is a significant association between female young people in Year 7 to Year 12 not eating or sleeping because of their mobile phone and having low self-esteem (not feeling happy with themselves). This association is not evident for male young people in this age group.10
The WA Department of Health administers the WA Health and Wellbeing Surveillance System to monitor the health of WA’s general population, which includes interviewing WA parents and carers about the health of their children aged 0 to 15 years.11 They ask parents and carers about their children’s screen-based activities and based on these responses reported that the majority (78.6%) of WA children and young people aged five to 15 years met the guidelines in 2019. The data is not disaggregated further by age and therefore we have not reproduced it here.
The last Australian Bureau of Statistics survey with data on screen time for children and young people was the Australian Health Survey: Physical Activity: 2011-2012.
In this survey the average time an Australian 12 to 14-year-old young person spent on sedentary screen-based activities per day was 157 minutes, while 15 to 17-year-old Australian young people spent 181 minutes per day.12 These average times are well above the recommended maximum of two hours (120 minutes) per day. These times are likely to have increased significantly over the past 10 years due to the substantial increase in availability of mobile technology and the popularity of social media.
Data from the Longitudinal Study of Australian Children similarly found that young people aged 12 to 13 years spent 196 minutes per day on screen-based activities on average. Television was the main medium for screen-based activities for all age groups, with young people aged 12 to 13 years watching an average of 116 minutes of television per weekday.13
In this research, the proportion of young people who met the screen-based activity guidelines was similar among male and female young people. However, there were gender differences in the types of activities. Male young people were more likely than female young people to have spent at least an hour per day on electronic games within each age category. On weekdays, female young people spent more time using the computer for homework, social networking and online communication than male young people.14
The findings from this research also suggest that children and young people who enjoy doing physical activities spend less time in front of screens.15 This highlights the importance of engaging children and young people in fun physical activities to provide the foundation for an active life.
In 2020, the Australian Communications and Media Authority published the Kids and mobiles – How Australian children are using mobile phones to explore how children and young people aged six to 13 years use their mobile phones.16 This survey is conducted annually by Roy Morgan and involves interviewing approximately 2,500 children and young people.17
For young people aged 12 to 13 years, they found the most common uses for mobile phones was to send or receive texts (85.0%), to take photos and videos (80.0%), to use apps (including social media) (78.0%), to take and receive calls from parents and family (77.0%) and to play games (74.0%) and listen to music (72.0%).18
In 2017, the Australian eSafety Commissioner conducted the Digital Participation Survey with more than 3,000 young people in Australia aged 8 to 17 years and collected information on their online safety experiences and behaviours. In this survey the most common social media services used by young people aged 13 to 17 years were YouTube (86.0%), Facebook (75.0%), Instagram (70.0%) and Snapchat (67.0%).19
Aboriginal young people
Research suggests that Aboriginal families are generally less likely than non-Aboriginal families to have access to the internet at home.20
The ABS conducted the Australian Aboriginal and Torres Strait Islander Health Survey: Physical activity in 2012–13 and found that 46.5 per cent of WA Aboriginal children and young people aged five to 17 years in non-remote areas met the screen-based activity recommendation on all three days prior to the survey, compared with only 36.4 per cent of WA non-Aboriginal children and young people.21
There is no information available on the proportion of WA Aboriginal young people in remote areas meeting the screen-based activity (sedentary behaviour) recommendations.
In SOS19 a significantly lower proportion of Aboriginal students than non-Aboriginal students in Year 7 to Year 12 reported they usually spend time using the internet on a smartphone or computer when they are not at school every day or almost every day (Aboriginal: 74.0%, non-Aboriginal: 87.6%).
|
Aboriginal |
Non-Aboriginal |
|
|
Every day or almost every day |
74.0 |
87.6 |
|
Once or twice a week |
14.3 |
7.5 |
|
Less than once a week |
5.3 |
2.2 |
|
Hardly ever or never |
4.0 |
1.9 |
|
I don't know |
2.4 |
0.9 |
Source: Commissioner for Children and Young People WA 2020, Speaking Out Survey 2019 Data Tables [unpublished]
Research shows that Aboriginal families are less likely than non-Aboriginal families to have access to the internet at home.22,23 Reasons for this include that Aboriginal families are more likely to be living in poverty than non-Aboriginal families, and internet availability is lower in regional and remote areas (compared to the metropolitan area) where a greater proportion of Aboriginal families live.24,25
Due to the increasing accessibility and popularity of screen-based activities, the impact of increased use on young people’s physical and emotional wellbeing is critical to monitor now and into the future.
Endnotes
- Yu M and Baxter J 2016, Australian children’s screen time and participation in extracurricular activities, in The Longitudinal Study of Australian Children Annual Statistical Report 2015, Australian Institute of Family Studies.
- Laurson KR et al 2014, Concurrent associations between physical activity, screen time, and sleep duration with childhood obesity, International Scholarly Research Notices: Obesity, March 2014.
- Fuller C et al 2017, Bedtime Use of Technology and Associated Sleep Problems in Children, Global Pediatric Health, Vol 4.
- Stiglic N and Viner RM 2019, Effects of screentime on the health and well-being of children and adolescents: a systematic review of reviews, BMJ Open, Vol 9.
- Alvarez-Peregrina C et al 2020, The Relationship Between Screen and Outdoor Time With Rates of Myopia in Spanish Children, Frontiers in Public Health, Vol 8.
- Khouja J et al 2020, Is screen time associated with anxiety or depression in young people? Results from a UK birth cohort, BMC Public Health, Vol 19, No 82.
- Barthorpe A et al 2020, Is social media screen time really associated with poor adolescent mental health? A time use diary study, Journal of Affective Disorders, Vol 274.
- WA Department of Health 2019, Sedentary behaviour, WA Government, [website].
- Commissioner for Children and Young People WA 2020, Speaking Out Survey: The views of WA children and young people on their wellbeing - a summary report, Commissioner for Children and Young People WA.
- Commissioner for Children and Young People WA 2020, Speaking Out Survey 2019 Data Tables, Commissioner for Children and Young People WA.
- The WA Department of Health’s, Health and Wellbeing Surveillance System is a continuous data collection which was initiated in 2002 to monitor the health status of the general population. In 2019, 546 parents/carers of children aged 0 to 15 years were randomly sampled and completed a computer assisted telephone interview between January and December, reflecting an average participation rate of just over 90 per cent. The sample was then weighted to reflect the WA child population.
- Australian Bureau of Statistics (ABS) 43640 Australian Health Survey - National Nutrition and Physical Activity Survey (NNPAS) 2011-12 – Table 20.1 Average time spent on sedentary screen-based activity, Children aged 5–17 years (minutes), ABS.
- Yu M and Baxter J 2016, Australian children’s screen time and participation in extracurricular activities, in The Longitudinal Study of Australian Children Annual Statistical Report 2015, Australian Institute of Family Studies, p. 102, 106.
- Ibid, p. 114.
- Ibid, p. 119-120.
- Australian Communications and Media Authority (ACMA) 2020, Kids and mobiles: how Australian children are using mobile phones, Australian Government [online].
- Ibid.
- Ibid.
- Office of the eSafety Commissioner 2018, State of Play – Youth, Kids and Digital Dangers, Office of the eSafety Commissioner, p. 8.
- Radoll P & Hunter B 2017, Dynamics of the digital divide: Working Paper No. 120/2017, Centre for Aboriginal Economic Policy Research, The Australian National University, p. 10.
- Australian Bureau of Statistics (ABS), 4727.0.55.004 - Australian Aboriginal and Torres Strait Islander Health Survey: Physical activity, 2012–13, Table 9.3 Whether met physical and screen-based activity recommendations by Indigenous status by selected characteristics, children aged 5–17 years in non-remote areas (proportion), ABS.
- Radoll P & Hunter B 2017, Dynamics of the digital divide: Working Paper No. 120/2017, Centre for Aboriginal Economic Policy Research, The Australian National University, p. 10.
- Thomas J et al 2018, Measuring Australia’s digital divide: the Australian digital inclusion index 2018, RMIT University, p. 6.
- Markham F and Biddle N 2018, Income, Poverty and Inequality: 2016 Census Paper No. 2, Centre for Aboriginal Economic Policy Research, Australian National University, p. 16.
- Thomas J et al 2018, Measuring Australia’s digital divide: the Australian digital inclusion index 2018, RMIT University, p. 6.
Last updated August 2021
Young people need to have a nutritious and balanced diet to grow and develop in a healthy way, and to reduce the risk of developing chronic diseases later in life. Research has shown that eating a wide variety of nutritious foods and limiting consumption of fatty and sugary foods is critical to healthy development and growth.1
Eating regular meals is important because eating irregularly can increase the risk of developing an eating disorder2 and has been linked with a higher risk of diseases such as high blood pressure, type 2 diabetes and obesity.3
The Australian Government publishes the Australian Dietary Guidelines to provide guidance on foods, food groups and dietary patterns that protect against chronic disease and provide the nutrients required for optimal health and wellbeing. The guidelines are:
- To achieve and maintain a healthy weight, be physically active and choose amounts of nutritious food and drinks to meet your daily energy needs.
- Enjoy a wide variety of nutritious foods from the five food groups every day.
- Limit intake of foods containing saturated fat, added salt, added sugars and alcohol.
- Encourage, support and promote breastfeeding.
- Care for your food; prepare and store it safely.
In 2019, the Commissioner conducted the Speaking Out Survey (SOS19) which sought the views of a broadly representative sample of 4,912 Year 4 to Year 12 students in WA on factors influencing their wellbeing, including a range of questions on physical health.4
Overall, one-third (32.6%) of Year 7 to Year 12 students reported caring very much about eating healthy food, while 17.3 per cent of students reported only caring a little (14.8%) or not at all (2.5%).
|
Male |
Female |
Metropolitan |
Regional |
Remote |
All |
|
|
Very much |
30.1 |
36.1 |
31.6 |
36.8 |
36.9 |
32.6 |
|
Some |
51.5 |
48.1 |
51.3 |
44.2 |
47.1 |
50.1 |
|
A little |
15.3 |
14.4 |
14.5 |
16.4 |
15.4 |
14.8 |
|
Not at all |
3.0 |
1.4 |
2.6 |
2.6 |
0.5 |
2.5 |
Source: Commissioner for Children and Young People WA 2020, Speaking Out Survey 2019 Data Tables [unpublished]
There were no significant differences in responses between male and female students or students in different geographical regions. There were also no significant differences between Aboriginal and non-Aboriginal students.5
There were significant differences between responses of students in primary school compared to high school. Year 4 to Year 6 students were significantly more likely to care very much about eating healthy food than Year 7 to Year 12 students.
|
Years 4 to 6 |
Years 7 to 9 |
Years 10 to 12 |
|
|
Very much |
50.1 |
33.3 |
31.8 |
|
Some |
38.3 |
48.0 |
52.4 |
|
A little |
8.9 |
15.5 |
14.1 |
|
Not at all |
2.8 |
3.2 |
1.6 |
Source: Commissioner for Children and Young People WA 2020, Speaking Out Survey 2019 Data Tables [unpublished]
Proportion of Year 4 to Year 12 students reporting they care very much, some, a little or not at all about eating healthy food by year group, per cent, WA, 2019
Source: Commissioner for Children and Young People WA 2020, Speaking Out Survey 2019 Data Tables [unpublished]
The largest decrease in students caring very much about eating healthily occurs in the transition from primary school (Year 4 to Year 6) to early high school (Year 7 to Year 9).
Students in SOS19 were asked how often they usually ate breakfast, lunch and dinner.
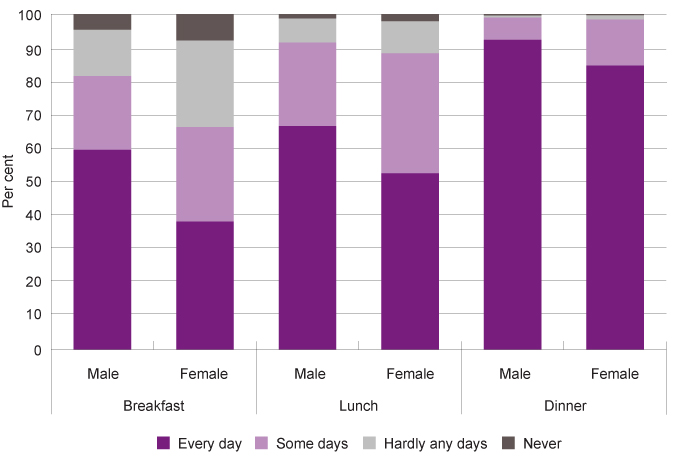
For all students in Years 7 to 12, 48.9 per cent reported eating breakfast, 59.7 per cent reported eating lunch and 88.5 per cent reported eating dinner every day.6
Across all three regular meal categories, female students in Years 7 to 12 were less likely than male students to say that they usually ate these meals every day. Notably, a majority (61.9%) of female students said they do not eat breakfast every day and almost one-half (47.5%) do not eat lunch every day.
One-third (33.7%) of female students reported eating breakfast hardly any days (25.8%) or never (7.9%).
|
Breakfast |
Lunch |
Dinner |
||||
|
Male |
Female |
Male |
Female |
Male |
Female |
|
|
Every day |
59.5 |
38.1 |
66.6 |
52.5 |
92.3 |
84.6 |
|
Some days |
22.0 |
28.2 |
24.9 |
35.8 |
6.6 |
13.7 |
|
Hardly any days |
13.8 |
25.8 |
7.1 |
9.5 |
0.7 |
1.3 |
|
Never |
4.7 |
7.9 |
1.3 |
2.2 |
0.5 |
0.4 |
Source: Commissioner for Children and Young People WA 2020, Speaking Out Survey 2019 Data Tables [unpublished]
Proportion of Year 7 to Year 12 students saying they eat breakfast, lunch or dinner every day, some days, hardly any days or never by meal and gender, per cent, WA, 2019
Source: Commissioner for Children and Young People WA 2020, Speaking Out Survey 2019 Data Tables [unpublished]
Analysis of the SOS19 results shows that there is a statistically significant relationship between young people not eating breakfast every day and not feeling good about themselves. This was particularly strong for female Year 7 to Year 12 students.7
Research suggests that adolescents, particularly young females, often worry about their weight and can idealise ultra-thin bodies. This can lead to attempts to control their weight through unhealthy eating behaviours including meal skipping and using extreme diets.8,9
A key component of the Australian Dietary Guidelines are the recommended daily serves of fruit and vegetables.
|
12 to 18 years |
|
|
Minimum recommended number of serves of vegetables per day |
|
|
Boys |
5½ |
|
Girls |
5 |
|
Minimum recommended number of serves of fruit per day |
|
|
Boys |
2 |
|
Girls |
2 |
Source: National Health and Medical Research Council 2013, Australian Dietary Guidelines
The guidelines for fruit and vegetable consumption were revised by the National Health and Medical Research Council (NHMRC) in 2013. This had the effect of increasing the recommended serves of vegetables and reducing the recommended amount of fruit for some age groups.10
The WA Department of Health administers the WA Health and Wellbeing Surveillance System to monitor the health of WA’s general population, which includes interviewing WA parents and carers about the health of their children aged 0 to 15 years.11 In this survey they ask parents and carers about their children’s eating behaviours and based on these responses determine the proportion of WA children and young people meeting the fruit and vegetable consumption guidelines.
In this survey, almost two out of three (61.3%) children and young people aged nine to 15 years consume the daily recommended serves of fruit, however the estimated proportion of children and young people eating sufficient vegetables in the same age bracket is very low (7.6%).
There has been little change in children and young people’s fruit and vegetable consumption since 2014.
|
Consuming recommended |
||
|
2014 |
64.0 |
8.8 |
|
2015 |
62.7 |
6.5 |
|
2016 |
59.6 |
8.3 |
|
2017 |
61.7 |
4.1 |
|
2018 |
65.4 |
6.2* |
|
2019 |
61.3 |
7.6* |
Source: Dombrovskaya M et al 2020, Health and Wellbeing of Children in Western Australia in 2019, Overview and Trends, WA Department of Health (and previous years’ reports)12
* Prevalence estimate has a relative standard error of 25 per cent to 50 per cent and should be used with caution.
Note: As the consumption of half serves is not captured in the questions currently asked in the WA Health survey, for the purposes of reporting, the recommended number of serves is rounded down to the nearest whole number.
This survey does not report results for young people aged 16 to 17 years.
The Australian Bureau of Statistics (ABS) conducted the National Health Survey in 2014–15 and 2017–18 which reported on daily intake of fruit and vegetables for young people. This data is relatively consistent with the results of the WA Health and Wellbeing Surveillance System with a very low proportion of young people in WA meeting the daily vegetable intake.
|
12 to 13 years |
14 to 18 years |
14 to 17 years |
|||
|
2014-15 |
2017-18 |
2014-15 |
2017-18 |
||
|
Fruit |
WA |
72.9 |
67.0* |
52.7 |
58.9* |
|
Australia |
68.0 |
62.2 |
50.7 |
58.3 |
|
|
Vegetables |
WA |
0.0** |
0.0** |
6.5 |
6.1 |
|
Australia |
1.4 |
2.6 |
3.7 |
5.7 |
|
Source: 43640: National Health Survey: Updated Results, 2014–15 and National Health Survey: Updated Results, 2017–18, Table 17.3 Children's daily intake of fruit and vegetables and main type of milk consumed, Proportion of persons, WA and Australia
Note: The age groups were changed in 2017–18.
* Proportion has a high margin of error and should be used with caution.
** The zero result means there was no data collected for this category in the sample. It does not represent a population estimate.
|
12 to 13 years |
14 to 18 years |
14 to 17 years |
||
|
2014-15 |
2017-18 |
2014-15 |
2017-18 |
|
|
Does not usually eat vegetables |
15.6 |
7.4* |
5.4 |
7.3 |
|
1 serve of less |
22.1 |
24.0* |
36.5 |
26.5 |
|
2 serves |
31.9 |
38.1* |
20.3 |
25.6 |
|
3 serves |
13.7 |
11.1* |
23.0 |
27.8* |
|
4 serves |
10.9 |
3.0* |
11.4 |
3.6* |
|
5 serves or more |
2.7 |
0.0** |
6.0 |
9.6 |
|
Total |
100.0 |
100.0 |
100.0 |
100.0 |
Source: 43640: National Health Survey: Updated Results, 2014–15 and National Health Survey: Updated Results, 2017–18, Table 17.3 Children's daily intake of fruit and vegetables and main type of milk consumed, Proportion of persons, WA and Australia
* Proportion has a high margin of error and should be used with caution.
** The zero result means there was no data collected for this category in the sample. It does not represent a population estimate.
Some of the data for 2017–18 has a high margin of error and therefore should be considered with caution.
In 2017–18, almost one-third (31.4%) of 12 to 13-year-olds were eating only one or no serves of vegetables on a daily basis (although with a high margin of error). A similar proportion (33.8%) of young people aged 14 to 17 years ate one serve or less of vegetables.
The ABS also conducted the National Aboriginal and Torres Strait Islander Health Survey in 2018–19 and reported that the majority of Aboriginal young people aged 12 to 17 years in Australia were not consuming sufficient fresh vegetables in 2018–19.
|
12 to 13 years |
14 to 17 years |
|
|
Adequate daily fruit intake |
56.4* |
50.8 |
|
Adequate daily vegetable intake |
3.9 |
3.8 |
Source: Australian Bureau of Statistics, National Aboriginal and Torres Strait Islander Health Survey, Australia, 2018–19, Table 17.3 Selected dietary indicators, by age, sex and remoteness, Aboriginal and Torres Strait Islander children aged 2–17 years, 2018–19, Proportion of persons
* Estimate has a high margin of error and should be used with caution.
Fresh fruit and vegetables have less availability and affordability in remote and regional locations, where a large proportion of Aboriginal children and young people live.13 The 2013 WA Food Access and Cost Survey found that food costs increased significantly with distance from Perth, and cost substantially more in very remote areas. At the same time, fruit and vegetable quality was generally lower in remote communities.14
Research also suggests that people living in poverty or with low incomes are more likely to eat calorie rich (high fat, high sugar) foods. The poverty rate for Aboriginal Australians is significantly higher than for non-Aboriginal Australians.15
Refer to the following resource for a more detailed discussion on nutrition among Aboriginal communities:
Lee A and Ride K 2018, Review of nutrition among Aboriginal and Torres Strait Islander people, Australian Indigenous HealthInfoNet.
The low level of vegetable consumption for all WA young people is of significant concern.
Guideline three of the Australian Dietary Guidelines recommends that individuals should limit intake of foods and drinks containing saturated fats and added sugars such as biscuits, cakes, confectionary, sugar-sweetened soft drinks and cordials, fruit drinks and sports drinks.16
Reducing young people’s sugar consumption has been highlighted as particularly critical. Sugar consumption in childhood and adolescence is directly linked to being overweight and obese, and having dental health conditions, both of which impact lifelong health.17 There is also strong evidence to suggest that foods and drinks consumed by children early in life establish their preferences for tastes (e.g. sweetness) later in life.18
Unlike serves of fruit and vegetables, the consumption of sugar is more complex to measure as sugar occurs naturally in many foods. The World Health Organisation recommends reducing the intake of free sugars – which include sugars added to foods by the manufacturer, cook or consumer plus those naturally present in honey, syrups and fruit juices – to less than 10 per cent of total energy intake in both adults and children.19
There is limited data on WA young people’s consumption of sugar.
The ABS National Health Survey collects data on young people’s consumption of sugar-sweetened drinks based on parent’ reports.
|
12 to 13 years |
14 to 17 years |
|
|
WA |
48.2* |
48.8* |
|
Australia |
42.0 |
42.5 |
Source: Australian Bureau of Statistics, National Health Survey, First Results 2017–18 – Australia and Western Australia, Table 17.3 Children's consumption of fruit, vegetables, and selected sugar sweetened and diet drinks
* This proportion has a margin of error between 10 and 20 per cent and should be used with caution.
Note: Sugar-sweetened drinks includes soft drink, cordials, sports drinks or caffeinated energy drinks. May include soft drinks in ready to drink alcoholic beverages. Excludes fruit juice, flavoured milk, 'sugar free' drinks, or coffee / hot tea.
While the WA data in the 2017–18 survey has a high margin of error, it suggests that less than half of WA young people aged 12 to 13 years and 14 to 17 years are reported by their parents to not consume any sugar-sweetened drinks on a daily basis.20 The estimate for both age groups is slightly higher than the result for all Australian children in those age groups, subject to the margin of error.
Endnotes
- National Health and Medical Research Council 2013, Australian Dietary Guidelines: Providing the scientific evidence for healthier Australian diets, Canberra, National Health and Medical Research Council.
- O’Connor M et al 2017, Eating problems in mid-adolescence, in The Longitudinal Study of Australian Children Annual Statistical Report 2017, Australian Institute of Family Studies, pp. 113-124.
- Pot G et al 2016, Meal irregularity and cardiometabolic consequences: Results from observational and intervention studies, Proceedings of the Nutrition Society, Vol 75 No 4.
- Commissioner for Children and Young People WA 2020, Speaking Out Survey: The views of WA children and young people on their wellbeing - a summary report, Commissioner for Children and Young People WA.
- Commissioner for Children and Young People WA 2020, Speaking Out Survey 2019 Data Tables, Commissioner for Children and Young People WA.
- Ibid.
- Ibid.
- O’Connor M et al 2017, Eating problems in mid-adolescence, in The Longitudinal Study of Australian Children Annual Statistical Report 2017, Australian Institute of Family Studies, p. 117.
- Aparicio-Martinez P et al 2019, Social Media, Thin-Ideal, Body Dissatisfaction and Disordered Eating Attitudes: An Exploratory Analysis, International Journals of Environmental Research and Public Health, Vol 16.
- Prior to 2013, children aged 4 to 11 years of age were recommended to eat at least one serve of fruit each day, while 12 to 18 year olds were recommended to eat three serves. While children aged 4 to 7 years of age were recommended to eat at least two serves of vegetables each day, 8 to 11 year olds eat at least three serves a day and 12 to 15 year olds eat at least four serves a day. NHMRC Australian dietary guidelines for children and adolescence 2003 (since rescinded).
- The WA Department of Health’s, Health and Wellbeing Surveillance System is a continuous data collection which was initiated in 2002 to monitor the health status of the general population. In 2019, 546 parents/carers of children aged 0 to 15 years were randomly sampled and completed a computer assisted telephone interview between January and December, reflecting an average participation rate of just over 90 per cent. The sample was then weighted to reflect the WA child population.
- This data has been sourced from individual annual Health and Wellbeing Surveillance System reports and therefore has not been adjusted for changes in the age and sex structure of the population across these years nor any change in the way the question was asked. No modelling or analysis has been carried out to determine if there is a trend component to the data, therefore any observations made are only descriptive and are not statistical inferences.
- Department of the Prime Minister and Cabinet, Aboriginal and Torres Strait Islander Health Performance Framework 2014 Report, 2.19 Dietary behaviours, Australian Government.
- Pollard CM et al 2015, Food Access and Cost Survey 2013 Report, WA Department of Health.
- Australian Council of Social Services (ACOSS) 2018, Poverty in Australia 2018, ACOSS and University of New South Wales, p. 65.
- National Health and Medical Research Council 2013, Australian Dietary Guidelines: Providing the scientific evidence for healthier Australian diets, National Health and Medical Research Council.
- Diep H et al 2017, Factors influencing early feeding of foods and drinks containing free sugars—a birth cohort study, International Journal of Environmental Research and Public Health, Vol 14, No 10.
- Ibid.
- World Health Organisation (WHO) 2015, Guideline: Sugars intake for adults and children, WHO.
- Australian Bureau of Statistics (ABS) 2019, National Health Survey, First Results 2017-18 – Western Australia, Table 17.3 Children's consumption of fruit, vegetables, and selected sugar sweetened and diet drinks, proportion of persons, ABS.
Last updated August 2021
Being overweight or obese in childhood and adolescence increases the likelihood of poor physical health in both the short and long term. Being obese increases a young person’s risk of a range of conditions such as asthma, type 2 diabetes1 and cardiovascular conditions.2 In recent years more children are being diagnosed with type 2 diabetes, when it was previously considered a disease of adulthood.3
Young people who are overweight or obese are more likely to be overweight or obese in adulthood.4 Overweight or obese young people who continue to be overweight or obese in adulthood face a higher risk of developing coronary heart disease, diabetes, certain cancers, gall bladder disease, osteoarthritis and endocrine disorders.5 Obesity in young people is also associated with a number of psychosocial problems, including social isolation, discrimination and low self-esteem.6
While obesity is often the focus of research and data, some young people are underweight which can be related to body image issues and eating disorders.
Adolescence can be a challenging time for young people as puberty changes their body weight, shape and appearance.7 At the same time, emotional changes and social influences impact young people’s self-perceptions. For many young people there can be a strong desire to achieve their ‘ideal’ body shape, which can be different across genders. For male young people the focus can often be on developing strength and/or muscle tone, while for female young people the focus will often be on being slim. These ideals can then influence body image concerns and weight worry.8,9
In 2019, the Commissioner conducted the Speaking Out Survey (SOS19) which sought the views of a broadly representative sample of 4,912 Year 4 to Year 12 students in WA on factors influencing their wellbeing, including a range of questions on physical health.10
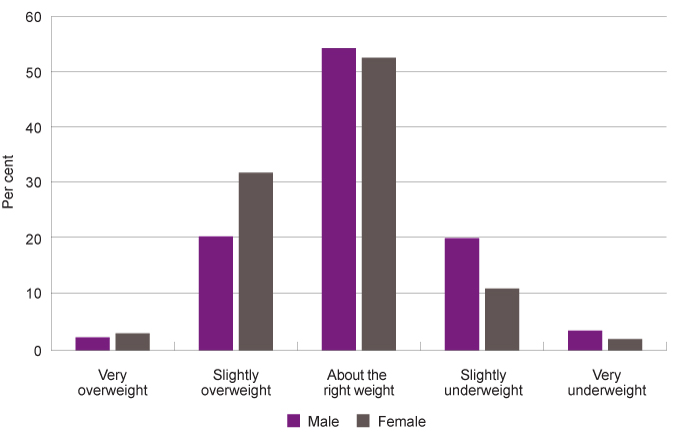
Overall, one-half (52.7%) of Year 7 to Year 12 students reported they were about the right weight, while 28.7 per cent reported they were overweight and 18.6 per cent reported they were underweight.
|
Male |
Female |
Metropolitan |
Regional |
Remote |
All |
|
|
Very overweight |
2.3 |
3.0 |
3.0 |
1.8 |
4.5 |
2.9 |
|
Slightly overweight |
20.3 |
31.7 |
26.3 |
24.0 |
24.1 |
25.8 |
|
About the right weight |
53.9 |
52.2 |
51.9 |
55.9 |
55.3 |
52.7 |
|
Slightly underweight |
20.0 |
11.0 |
16.0 |
14.9 |
15.5 |
15.8 |
|
Very underweight |
3.5 |
2.0 |
2.9 |
3.3 |
N/A |
2.8 |
Source: Commissioner for Children and Young People WA 2020, Speaking Out Survey 2019 Data Tables [unpublished]
Proportion of Year 7 to Year 12 students reporting they think they are very overweight, slightly overweight, about the right weight, slightly underweight or very underweight by gender, per cent, WA, 2019
Source: Commissioner for Children and Young People WA 2020, Speaking Out Survey 2019 Data Tables [unpublished]
There is a significant difference for male and female young people, with 34.7 per cent of female Year 7 to Year 12 students reporting they were overweight or obese compared to 22.6 per cent of male students. Male students were significantly more likely than female students to report that they are underweight (23.5% compared to 13.0%). This is consistent with the differing body ideals for male and female young people.
Importantly, data from the National Health Survey (reported below), suggest that male young people are more likely to be overweight and obese than female young people.
More than two-thirds (70.3%) of female Year 7 to 12 students worry about their weight compared to over one-third (36.8%) of male students. Of those, 29.9 per cent of female students worry a lot about their weight, compared to 8.9 per cent of male students.
|
Male |
Female |
Metropolitan |
Regional |
Remote |
All |
|
|
I worry a lot |
8.9 |
29.9 |
18.2 |
24.2 |
15.1 |
18.9 |
|
I worry a little |
27.9 |
40.4 |
35.0 |
29.7 |
29.0 |
33.9 |
|
I don't worry much |
31.6 |
18.0 |
24.6 |
24.4 |
31.9 |
25.0 |
|
I don't worry at all |
31.6 |
11.7 |
22.2 |
21.7 |
24.1 |
22.2 |
Source: Commissioner for Children and Young People WA 2020, Speaking Out Survey 2019 Data Tables [unpublished]
The proportion of female students reporting they worried a lot about their weight increased progressively as they move through high school (13.8% in Year 7, 33.2% in Year 9 and 38.7% in Year 11 – reducing to 33.5% in Year 12).11
There were no significant differences in worrying about weight between geographical regions, although students in remote regions were generally less likely to worry.
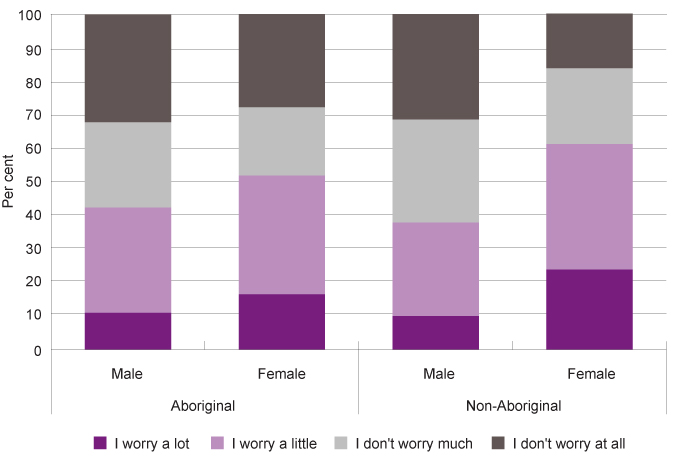
Female Aboriginal high school students were much less likely than female non-Aboriginal students to worry a lot about their weight (19.9% compared to 30.5%), although they still were still much more worried than Aboriginal male students.
|
Aboriginal |
Non-Aboriginal |
|||||
|
Male |
Female |
All |
Male |
Female |
All |
|
|
I worry a lot |
6.6 |
19.9 |
13.5 |
9.0 |
30.5 |
19.3 |
|
I worry a little |
29.6 |
43.9 |
36.9 |
27.9 |
40.2 |
33.7 |
|
I don't worry much |
32.4 |
21.9 |
26.7 |
31.6 |
17.7 |
24.9 |
|
I don't worry at all |
31.4 |
14.3 |
22.9 |
31.6 |
11.6 |
22.1 |
Source: Commissioner for Children and Young People WA 2020, Speaking Out Survey 2019 Data Tables [unpublished]
Proportion of Year 7 to Year 12 students reporting they worry a lot, a little, don’t worry much or don’t worry at all about their weight by Aboriginal status, per cent, WA, 2019
Source: Commissioner for Children and Young People WA 2020, Speaking Out Survey 2019 Data Tables [unpublished]
The WA Department of Health administers the WA Health and Wellbeing Surveillance System, interviewing WA parents and carers of children aged 0 to 15 years.12 In this survey parents and carers of children aged five to 15 years are asked to provide their child’s height without shoes and weight without clothes or shoes. A Body Mass Index (BMI) is derived from these figures by dividing weight in kilograms by height in metres squared. BMI scores take into account the age and sex of the young person.13
The use of BMI to measure healthy weight is contested, particularly as it does not distinguish between fat and muscle or the location of the fat.14 BMI is not a diagnostic tool. If a child or young person has a high BMI for their age and sex they should be referred to a health professional for further assessment considering physical activity and diet, and using other measures such as skin fold thickness or dual energy X-ray absorptiometry (DEXA).15,16,17 BMI is however considered an appropriate tool for population level measurement and trend analysis.18
Just under one-quarter (22.8%) of WA children and young people aged five to 15 years were categorised as overweight or obese in 2019. This proportion has been relatively stable over time however the past two years have seen successive decreases.
|
Not overweight |
Overweight or obese |
Overweight |
Obese |
|
|
2004 |
73.9 |
26.1 |
19.1 |
7.0* |
|
2005 |
71.7 |
28.4 |
19.5 |
8.9 |
|
2006 |
79.0 |
20.9 |
15.1 |
5.8 |
|
2007 |
82.5 |
17.5 |
12.9 |
4.6* |
|
2008 |
80.3 |
19.7 |
14.0 |
5.7 |
|
2009 |
77.3 |
22.7 |
16.9 |
5.8 |
|
2010 |
77.0 |
23.0 |
17.0 |
6.0 |
|
2011 |
81.2 |
18.7 |
14.5 |
4.2* |
|
2012 |
77.9 |
22.1 |
14.7 |
7.4 |
|
2013 |
78.9 |
21.1 |
15.1 |
6.0 |
|
2014 |
77.4 |
22.6 |
13.9 |
8.7 |
|
2015 |
78.4 |
21.6 |
15.6 |
6.0 |
|
2016 |
76.3 |
23.6 |
18.2 |
5.4 |
|
2017 |
73.7 |
26.3 |
16.4 |
9.9 |
|
2018 |
75.7 |
24.3 |
17.6 |
6.7 |
|
2019 |
77.2 |
22.8 |
14.8 |
8.0 |
Source: Dombrovskaya M et al 2020, Health and Wellbeing of Children in Western Australia in 2019, Overview and Trends, WA Department of Health
* Prevalence estimate has a relative standard error of 25 per cent to 50 per cent and should be used with caution.
Note: This is trend data presented by the Department of Health. Data in all years to 2019 have been standardised by weighting them to the 2011 estimated resident population.
Proportion of children and young people aged 5 to 15 years by BMI categories, per cent, WA, 2004 to 2019
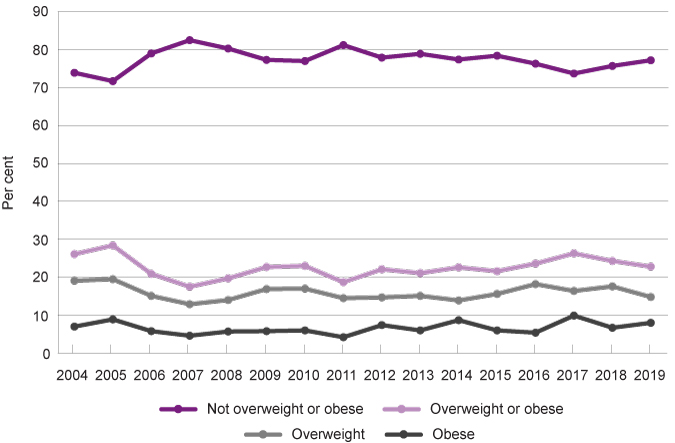
Source: Dombrovskaya M et al 2020, Health and Wellbeing of Children in Western Australia in 2019, Overview and Trends, WA Department of Health
In 2019, a slightly lower proportion (19.7%) of WA young people aged 10 to 15 years are overweight or obese than the broader age group of five to 15 years. There has been no substantive change in the proportion of young people aged 10 to 15 years who are overweight or obese over the last six years.
|
Overweight |
Obese |
Total |
|
|
2012 |
15.5 |
5.9 |
21.4 |
|
2013 |
14.4 |
4.1* |
18.5 |
|
2014 |
12.6 |
3.7* |
16.3 |
|
2015 |
16.2 |
4.6* |
20.8 |
|
2016 |
19.1 |
4.0* |
23.1 |
|
2017 |
16.2 |
6.3* |
22.5 |
|
2018 |
17.2 |
5.2* |
22.4 |
|
2019 |
16.0 |
3.7* |
19.7 |
Source: Dombrovskaya M et al 2020, Health and Wellbeing of Children in Western Australia in 2019, Overview and Trends, WA Department of Health (and previous years’ reports)19
* Prevalence estimate has a relative standard error of 25 per cent to 50 per cent and should be used with caution.
The Australian Bureau of Statistics National Health Survey collects data on BMI categories for young people across Australia, including the older age group of 16 to 17 years. The 2017–18 survey provides data for WA, however it has a high margin of error and has not been reproduced here.
Consistent with the WA Department of Health surveillance system, this survey reports that a higher proportion of children aged 8 to 11 years are overweight or obese than young people aged 12 to 15 years. However, it further shows that the proportion of young people who are overweight or obese then increases again for 16 to 17-year-olds.
|
Australia |
|||
|
8 to 11 years |
12 to 15 years |
16 to 17 years |
|
|
Underweight |
9.5 |
7.4 |
7.3 |
|
Normal weight |
65.4 |
71.6 |
65.8 |
|
Overweight |
17.7 |
14.8 |
18.0 |
|
Obese |
6.9 |
6.7 |
10.3 |
|
Overweight / obese |
25.2 |
20.8 |
28.1 |
Source: Australian Bureau of Statistics, National Health Survey 2017–18, Table 16.1 Children's Body Mass Index, waist circumference, height and weight, proportion of persons
The proportion of children and young people who are overweight or obese generally shifts across age groups. This is in part due to the growth and developmental phases as children move through adolescence and into adulthood. These patterns are generally different for male and female children and young people.
In 2019, similar proportions of male and female children and young people aged five to 15 years are categorised as overweight and obese, although these proportions have fluctuated considerably over recent years.
|
Male |
Female |
|||||
|
Not overweight or obese |
Overweight |
Obese |
Not overweight or obese |
Overweight |
Obese |
|
|
2012 |
76.9 |
14.4 |
8.7 |
78.9 |
15.0 |
6.0 |
|
2013 |
74.8 |
16.6 |
8.7* |
83.0 |
13.7 |
3.3* |
|
2014 |
78.6 |
13.4 |
8.0* |
75.6 |
14.5 |
10.0* |
|
2015 |
78.9 |
14.9 |
6.2* |
77.7 |
16.3 |
5.9* |
|
2016 |
77.8 |
16.5 |
5.7* |
74.9 |
19.8 |
5.3* |
|
2017 |
77.0 |
13.2 |
9.8 |
69.9 |
19.5 |
10.6 |
|
2018 |
81.5 |
12.1 |
6.4* |
69.8 |
23.2 |
7.1* |
|
2019 |
75.0 |
15.9 |
9.0* |
79.5 |
13.3 |
7.2* |
Source: Dombrovskaya M et al 2020, Health and Wellbeing of Children in Western Australia in 2019, Overview and Trends, WA Department of Health (and previous years’ reports) 20
* Prevalence estimate has a relative standard error of 25 per cent to 50 per cent and should be used with caution.
When prior year results are disaggregated further by age, it highlights that in general a greater proportion of female children aged six to 10 years are overweight or obese (32.0% in 2015–2016) than female children aged 11 to 15 years (18.9% in 2015–2016).
|
Male |
Female |
|||
|
6 to 10 years |
11 to 15 years |
6 to 10 years |
11 to 15 years |
|
|
2009-2010 |
24.5 |
24.4 |
26.8 |
17.5 |
|
2011-2012 |
23.6 |
19.9 |
20.9 |
21.1 |
|
2013-2014 |
27.3 |
20.8 |
28.4 |
14.9 |
|
2015-2016 |
23.5 |
21.0 |
32.0 |
18.9 |
Source: Custom report provided to the Commissioner for Children and Young People WA from the WA Department of Health Epidemiology Branch, Selected risk factor estimates for WA children using the WA Health and Wellbeing Surveillance System, 2009-2016
Thus, there is a decrease in the prevalent of overweight or obesity for female young people as they move from childhood to adolescence. This pattern is not as evident for male children and young people. These changes for female children and young people could be related to physical changes due to the final growth spurt for females often being between 10 and 12 years21 and possibly the beginning of female young people starting to manage their weight more directly.
The ABS National Health Survey further shows that male young people aged 16 to 17 years are more likely to be overweight and obese than female young people.
|
Male |
Female |
|||
|
12 to 15 years |
16 to 17 years |
12 to 15 years |
16 to 17 years |
|
|
Underweight |
5.4 |
8.1 |
8.1 |
4.3 |
|
Normal weight |
73.8 |
59.9 |
69.1 |
69.4 |
|
Overweight |
14.0 |
20.2 |
15.2 |
16.9 |
|
Obese |
7.2 |
10.7 |
5.7 |
8.7 |
|
Overweight / obese |
20.4 |
32.3 |
21.4 |
24.7 |
Source: Australian Bureau of Statistics, National Health Survey 2017–18, Table 16.1 Children's Body Mass Index, waist circumference, height and weight, Proportion of persons
There is a substantial increase in the proportion of male Australian young people that are in the overweight and obese categories from ages 12 to 15 (20.4%) to ages 16 to 17 (32.3%).
Contributing factors for this increase may be food choices including high consumption of sugary drinks for young men,22 a lack of physical activity, low quality sleep and a high level of sedentary behaviour.23 There is however also some evidence that BMI in male young people may not always reflect an increase in body fat, therefore this data should be considered with caution.24
In 2020, the Australian Institute of Health and Welfare (AIHW) presented a birth cohort analysis of prevalence of overweight and obesity for a particular group of people born in the same year. They noted that over the last 10 years (2007–08 to 2017–18) there has been no significant change in rates of obesity or overweight in Australian children aged between five and 14 years (23.1% of 5 to 14-year-olds in 2007–08 compared to 24.5% in 2017–18).25
There was, however, a significant increase in the proportion of young people aged 15 to 24 years who were overweight or obese compared to those born 10 years earlier (35.5% of 15 to 24-year-olds in 2007–08 compared to 40.6% of 15 to 24-year-olds in 2018–19). It should be noted that the proportion of young people aged 15 to 24 years who were obese had not increased significantly in that time period (12.6% in 2007–08 compared to 13.9% in 2018–19).26
The ABS survey also suggests that a significant proportion of Australian young people (around 7% of 12 to 17-year-olds) may be underweight.27
While rates of being overweight and obese are increasing for some age groups, unhealthy thin and ‘ultra-thin’ bodies are often idealised, particularly by female young people. The pressure to strive for such unattainable and unrealistic body images encourage body dissatisfaction and unhealthy eating behaviours.28
Data from the Longitudinal Study of Australian Children found that a small proportion of young people aged 14 to 15 years met the diagnostic criteria for eating disorders (3.4% for female young people and 1.4% for male young people).29 However, negative feelings and beliefs regarding gaining weight and loss of control of eating are common and can be problematic. These negative attitudes were very common for Australian female young people aged 14 to 15 years, with 54.0 per cent scared of gaining weight and 43.0 per cent expressing their concern that they had lost control of their eating or had eaten too much in the last four weeks.30
Analysis of the Speaking Out Survey data shows that there is a statistically significant relationship between Year 7 to Year 12 students worrying about their weight and caring about how they look. This relationship is stronger for female young people.31 The Speaking Out Survey found that more than one-half (54.9%) of female students in Year 7 to Year 12 cared very much about how they look compared to about one-third (32.1%) of male students.
Critically, in 2017 anorexia nervosa was the third most common principal diagnosis for young people aged 13 to 17 years discharged from a WA public hospital with a mental health diagnosis. For the small number of children from five to 12 years of age discharged from a WA public hospital with a mental health diagnosis, anorexia was the most common diagnosis (refer age group 12 to 17 Mental health Indicator for more information).32 This may be in part because children with anorexia are more likely to present at hospital than children with other common mental health conditions.
It is important that policies and programs to address rates of overweight and obesity consider the potentially harmful impacts of language which can stigmatise children and young people who may be overweight and obese. This can influence their body image, self-esteem and mental health and encourage unhealthy eating behaviours.33,34
The WA Health and Wellbeing survey asks parents and carers their perception of their child’s weight. For children aged five to 15 years with a BMI that classified them as overweight or obese, the majority (72.3%) had parents/carers who perceived their child’s weight to be normal.35 This highlights that some parents’ and carers’ perceptions of their children’s weight may be overly positive, although in some instances it may indicate how BMI can be an imperfect proxy for unhealthy weight as children age.
Children and young people living in WA regional and remote locations and areas of greater socio-economic disadvantage are much more likely to be overweight and obese.
|
WA |
Australia |
||
|
Remoteness |
Major cities |
18.5 |
26.2 |
|
Regional and remote |
27.3 |
25.9 |
|
|
Socioeconomic status |
Lowest SES |
27.3 |
33.9 |
|
Highest SES |
15.3 |
22.0 |
|
|
Total |
22.2 |
26.1 |
|
Source: AIHW, Children’s Headline Indicators, Breakdown by population group
Socio-economic disadvantage influences children and young people’s weight for multiple intersecting reasons including limited access to affordable fresh fruit and vegetables and easy access to fast food, availability of primary health services and access to quality outdoor green spaces.36 Additionally, parents with a lower level of education can often have less access to nutritional knowledge which can lead to less healthy dietary practices.37
Aboriginal children and young people
In 2012–13 the Australian Bureau of Statistics conducted the Australian Aboriginal and Torres Strait Islander Health Survey (AATSIHS). In this survey they measured the BMI of participating Aboriginal children and found that Aboriginal children and young people aged 10 to 14 years old were more likely than non-Aboriginal children and young people to be obese (11.8% compared to 6.3%) and less likely to be in the healthy weight range (54.2% compared to 67.3%). Aboriginal young people aged 15 to 17 were almost twice as likely to be obese than non-Aboriginal young people the same age (14.2% compared to 7.4%).38
In the 2018–19 National Aboriginal and Torres Strait Islander Health Survey, 15.4 per cent of 12 to 13-year-old Aboriginal young people were categorised as obese and 16.2 per cent of 14 to 17-year-olds.39 There was no comparative data for non-Aboriginal WA children in this survey, however, this is much higher than the proportion of non-Aboriginal young people who are obese.
A WA study also found that the rates of type 2 diabetes in WA children and young people increased significantly from 1990 to 2002 and that Aboriginal children and young people were six times more likely to have type 2 diabetes than the non-Aboriginal population.40
For complex reasons related to colonisation and intergenerational trauma, Aboriginal young people are more likely to have a history of poverty, social exclusion, family violence and families with drug and alcohol issues. These factors influence the rate of overweight and obesity in Aboriginal young people. There is also evidence that the quality and duration of sleep influences obesity. A recent study concluded that Aboriginal children aged five to 12 years have a higher BMI than non-Aboriginal children of the same age, at least in part, because some Aboriginal children sleep less than non-Aboriginal children.41
Aboriginal adults are 1.6 times more likely to be obese than non-Aboriginal adults indicating increased risk of developing chronic disease,42 it is therefore critical to address overweight and obesity for Aboriginal young people by addressing the possible foundational causes.
Endnotes
- Type 2 diabetes is a progressive condition of unknown cause which is associated with modifiable lifestyle risk factors such as obesity. Refer to Diabetes Australia for more information.
- Australian Institute of Health and Welfare (AIHW) 2012, A picture of Australia’s children 2012, Cat No PHE 167, AIHW.
- Davis E 2018, Submission 33 to the Education and Health Standing Committee of the WA Parliament Inquiry: The role of diet in type 2 diabetes prevention and management, Perth Children’s Hospital.
- Venn AJ et al 2007, Overweight and obesity from childhood to adulthood: a follow-up of participants in the 1985 Australian Schools Health and Fitness Survey, The Medical Journal of Australia, Vol 186, No 9.
- Australian Institute of Health and Welfare (AIHW) 2012, A picture of Australia’s children 2012, Cat No PHE 167, AIHW.
- Australian Research Alliance for Children and Youth (ARACY) 2008, ARACY Report Card, Technical Report: The Wellbeing of Young Australians, ARACY.
- Voelker D et al 2015, Weight status and body image perceptions in adolescents: current perspectives, Adolescent Health, Medicine and Therapeutics, Vol 6.
- Ibid, p. 150.
- Aparicio-Martinez P et al 2019, Social Media, Thin-Ideal, Body Dissatisfaction and Disordered Eating Attitudes: An Exploratory Analysis, International Journals of Environmental Research and Public Health, Vol 16, p. 10.
- Commissioner for Children and Young People WA 2020, Speaking Out Survey: The views of WA children and young people on their wellbeing - a summary report, Commissioner for Children and Young People WA.
- Commissioner for Children and Young People WA 2020, Speaking Out Survey 2019 Data Tables, Commissioner for Children and Young People WA.
- The WA Department of Health’s, Health and Wellbeing Surveillance System is a continuous data collection which was initiated in 2002 to monitor the health status of the general population. In 2019, 546 parents/carers of children aged 0 to 15 years were randomly sampled and completed a computer assisted telephone interview between January and December, reflecting an average participation rate of just over 90 per cent. The sample was then weighted to reflect the WA child population.
- National Health and Medical Research Council 2013, Clinical practice guidelines for the management of overweight and obesity in adults, adolescents and children in Australia, Australian Government, p. 84.
- There is also increasing evidence to suggest that the type of fat is more important than overall weight – for example fat around the stomach has been shown to be more harmful than fat in other locations. Therefore some research has shown that someone with a relatively high BMI can be healthier than someone with a BMI in the ‘healthy’ range. Refer to Tomiyama et al 2016, Misclassification of cardiometabolic health when using body mass index categories in NHANES 2005-2012, The International Journal of Obesity, Vol 40, No 5.
- Centers for Disease Control and Prevention 2018, About Child and Teen BMI, National Center for Chronic Disease Prevention and Health Promotion (website).
- Nooyens AC 2007, Adolescent skinfold thickness is a better predictor of high body fatness in adults than is body mass index: the Amsterdam Growth and Health Longitudinal Study, The American Journal of Clinical Nutrition, Vol 85, No 6.
- Jensen NSO et al 2016, Review Paper: Comparison of methods to measure body fat in 7-to-10-year-old children: a systematic review, Public Health, Vol 133.
- Centers for Disease Control and Prevention 2018, Body Mass Index: Considerations for practitioners, Department of Health and Human Services USA.
- This data has been sourced from individual annual Health and Wellbeing Surveillance System reports and therefore has not been adjusted for changes in the age and sex structure of the population across these years nor any change in the way the question was asked. No modelling or analysis has been carried out to determine if there is a trend component to the data, therefore any observations made are only descriptive and are not statistical inferences.
- This data has been sourced from individual annual Health and Wellbeing Surveillance System reports and therefore has not been adjusted for changes in the age and sex structure of the population across these years nor any change in the way the question was asked. No modelling or analysis has been carried out to determine if there is a trend component to the data, therefore any observations made are only descriptive and are not statistical inferences.
- Zheng W et al 2013, Multilevel Longitudinal Analysis of Sex Differences in Height Gain and Growth Rate Changes in Japanese School-Aged Children, Journal of Epidemiology, Vol 23, No 4.
- Scully M et al, 2012, Factors associated with high consumption of soft drinks among Australian secondary-school students, Public Health Nutrition, Vol 20, No 13.
- Morley B et al 2012, What factors are associated with excess body weight in Australian secondary school students?, The Medical Journal of Australia, Vol 196, No 3.
- Telford RD et al 2019, BMI is a misleading proxy for adiposity in longitudinal studies with adolescent males: The Australian LOOK study, Journal of Science & Medicine in Sport, Vol 22, No 3.
- Australian Institute of Health and Welfare (AIHW) 2020, Overweight and obesity in Australia: an updated birth cohort analysis, AIHW.
- Ibid.
- Australian Bureau of Statistics 2020, National Health Survey 2017–18, Table 16.1 Children's Body Mass Index, waist circumference, height and weight, Proportion of persons, ABS.
- O’Connor M et al 2017, Eating problems in mid-adolescence, in The Longitudinal Study of Australian Children Annual Statistical Report 2017, Australian Institute of Family Studies, p. 113.
- Ibid, p. 115.
- Ibid, p. 115.
- Commissioner for Children and Young People WA 2020, Speaking Out Survey 2019 Data Tables, Commissioner for Children and Young People WA.
- Custom report provided by the Department of Health to the Commissioner for Children and Young People WA on the top diagnoses of children and young people separating from a WA public or private hospital with a mental health diagnosis or discharged from a mental health inpatient unit.
- Russell-Mayhew S 2012, Mental Health, Wellness, and Childhood Overweight/Obesity, Journal of Obesity, Vol 2012.
- O’Dea JA 2012, Studies of obesity, body image and related health issues among Australian adolescents: how can programs in schools interact with and complement each other?, Journal of Student Wellbeing, Vol 4 No 2.
- Patterson C et al 2019, Health and Wellbeing of Children in Western Australia in 2018, Overview and Trends, WA Department of Health, p. 33.
- NSW Council of Social Services (NCOSS) 2016, Overweight and Obesity: Balancing the scales for vulnerable children, NCOSS.
- Ibid.
- Australian Bureau of Statistics 2014, Australian Aboriginal and Torres Strait Islander Health Survey: Updated Results, 2012–13 — Australia, Table 9.3 Body Mass Index of children(a), by age by Indigenous status by sex, Proportion of persons.
- Australian Bureau of Statistics 2020, National Aboriginal and Torres Strait Islander Health Survey, 2018–19, Table 19.3 Body Mass Index (BMI), by age and sex, Aboriginal and Torres Strait Islander children aged 2–17 years, 2018–19, Proportion of persons, ABS.
- McMahon SK et al 2004, Increase in type 2 diabetes in children and adolescents in Western Australia, Medical Journal of Australia, Vol 180, No 3.
- Deacon-Crouch M et al 2019, The mediating role of sleep in the relationship between Indigenous status and body mass index in Australian school-aged children, Journal of Paediatrics and Child Health, November 2018.
- Department of Prime Minister and Cabinet 2015, Aboriginal and Torres Strait Islander, Health Performance Framework 2014 Report, Australian Government.
Last updated August 2021
Long-term health conditions and disability are often inter-related. Long-term health issues and disability can both result in a functional limitation which impacts everyday life for children and young people. People with disability are more likely to develop long-term health conditions, and people with long-term health conditions are more likely to develop disability.1
The most common long-term health issues for children and young people are asthma, diabetes and cancer.2
The Australian Bureau of Statistics estimates 14,500 WA young people aged 12 to 17 years (7.9%) had reported disability in 2018.3 In the Disability, Ageing and Carers survey children and young people whose long-term health conditions limit their activities are identified as having disability.4
|
Number |
Per cent |
|
|
Profound or severe core activity limitation (a) |
5.5 |
3.0 |
|
Moderate or mild core activity limitation |
5.4 |
3.0 |
|
Schooling or employment restriction only |
3.8* |
2.1 |
|
All with specific limitations or restrictions |
12.8 |
7.0 |
|
All with reported disability (b) |
14.5 |
7.9 |
Source: Custom report provided to the Commissioner for Children and Young People WA by the Australian Bureau of Statistics based on the 2018 Disability, Ageing and Carers survey
* estimate has a relative standard error of 25 to 50 per cent and should be used with caution.
a) Profound or severe core activity limitation comprises:
- profound: the person is unable to do, or always needs help with, a core activity task.
- severe: the person sometimes needs help with a core activity task, and/or has difficulty understanding or being understood by family or friends, or can communicate more easily using sign language or other non-spoken forms of communication.
b) Includes those who do not have a specific restriction or limitation.
The types of disability (disability group) that are reported vary with age. This is in part because as children and young people age, developmental difficulties in certain areas (such as intellectual capacity or psychosocial) become more apparent.5
|
6 to 11 years |
12 to 17 years |
|
|
Sensory or speech |
38.4 |
19.3 |
|
Intellectual* |
67.8 |
56.2 |
|
Physical restriction |
20.3 |
29.0 |
|
Psychosocial** |
39.3 |
43.6 |
|
Head injury, stroke or acquired brain injury |
2.7 |
3.4 |
|
Other |
20.9 |
25.5 |
Source: Custom report provided to the Commissioner for Children and Young People WA by the Australian Bureau of Statistics based on the 2018 Disability, Ageing and Carers survey
Notes:
1. Young people can have one or more types of disability.
2. Survey responses are provided by parents of young people under 15 years and those parents/carers of young people over 15 years who did not agree to the young people being interviewed separately and young people over 15 years (when their parents/carers agreed).
* Intellectual disability is reported when a child/young person has difficulty learning or understanding things.
** Psychosocial includes mental illness or a condition requiring help or supervision and social or behavioural difficulties that restrict everyday activities.
In 2018, more than one-half (56.2%) of Australian young people aged 12 to 17 years with disability had intellectual disability (difficulty learning or understanding things) and 43.6 per cent had psychosocial disability, which included a mental health condition or behavioural difficulties.
Sixty-one per cent (61.1%) of male young people with disability report intellectual disability compared to 46.6 per cent of female young people with disability.
|
Male |
Female |
Total |
|
|
Sensory or speech |
22.9 |
15.0 |
19.3 |
|
Intellectual* |
61.1 |
46.6 |
56.2 |
|
Physical restriction |
25.1 |
35.4 |
29.0 |
|
Psychosocial** |
42.6 |
43.2 |
43.6 |
|
Head injury, stroke or acquired brain injury |
4.0 |
3.7 |
3.4 |
|
Other |
25.3 |
26.6 |
25.5 |
Source: Australian Bureau of Statistics, Disability, Ageing and Carers, Australia, 2018: Western Australia, Table 3.1: Children aged 0-14 years with disability, living in households, Disability group by Sex and Age – 2018
Note: Children can have one or more types of disability.
* Intellectual disability is reported when a child/young person has difficulty learning or understanding things.
** Psychosocial includes mental illness or a condition requiring help or supervision and social or behavioural difficulties that restrict everyday activities.
Long term health conditions also have a significant impact on children and young people with disability including impacting everyday activities. In 2018, three-quarters (74.0%) of children and young people aged 0 to 14 years with disability also reported a long-term health condition.
The most commonly reported long-term health conditions for Australian children and young people with disability aged 0 to 14 years in 2018 were autism and related disorders (26.8% of children and young people with disability), while asthma was also common (16.5%).6
The diagnosis of autism and related disorders in children with disability has increased since 2003 (2003: 6.2%, 2009: 13.0%, 2012: 19.9%, 2015: 24.4%, 2018: 26.8%).7
The diagnosis of phobic and anxiety-related disorders has increased substantially since 2012 (2012: 3.1%, 2015: 9.4%, 2018: 13.7%).
|
2012 |
2015 |
2018 |
|
|
Autism and related disorders |
19.9 |
24.4 |
26.8 |
|
Phoci and anxiety disorders |
3.1 |
9.4 |
13.7 |
|
Other developmental/learning disorders |
9.1 |
14.5 |
14.0 |
|
Attention deficit disorder/hyperactivity |
8.2 |
12.5 |
15.0 |
|
Asthma |
6.3 |
18.3 |
16.5 |
Source: Australian Bureau of Statistics, Disability, Ageing and Carers, Australia, 2018: Table 4.3: Children aged 0-14 years with disability, living in households, Long-term health condition by Sex - 2012, 2015, 2018, Proportion of persons
It should be noted that an increase in reported diagnoses over time, does not necessarily represent an increase in the proportion of children with a particular condition – the increase could be due to better diagnostic tools and/or greater community awareness leading to more assessments being carried out.
Diagnosis of many common conditions has been increasing in recent years for both male and female children and young people with disability.
In particular, phobic and anxiety-related disorders have increased from 1.9 per cent of female children and young people with disability in 2012 to 19.5 per cent of female children and young people with disability in 2018.
|
Male |
Female |
|||||
|
2012 |
2015 |
2018 |
2012 |
2015 |
2018 |
|
|
Autism and related disorders |
24.8 |
29.0 |
32.5 |
12.2 |
15.3 |
16.7 |
|
Phobic and anxiety disorders |
3.5 |
8.5 |
10.6 |
1.9 |
9.4 |
19.5 |
|
Other developmental/learning disorders |
9.4 |
15.5 |
13.5 |
6.9 |
14.3 |
15.5 |
|
Attention deficit disorder/hyperactivity |
9.7 |
15.4 |
18.6 |
6.4 |
6.8 |
8.9 |
|
Asthma |
4.3 |
19.9 |
15.9 |
7.3 |
14.8 |
17.2 |
Source: Australian Bureau of Statistics, Disability, Ageing and Carers, Australia, 2018: Table 4.3: Children aged 0-14 years with disability, living in households, Long-term health condition by Sex - 2012, 2015, 2018, Proportion of persons (and previous years’ tables)
Proportion of children and young people aged 0 to 14 years with disability who report a long-term health conditions by most common conditions and gender, per cent, Australia, 2012, 2015, 2018
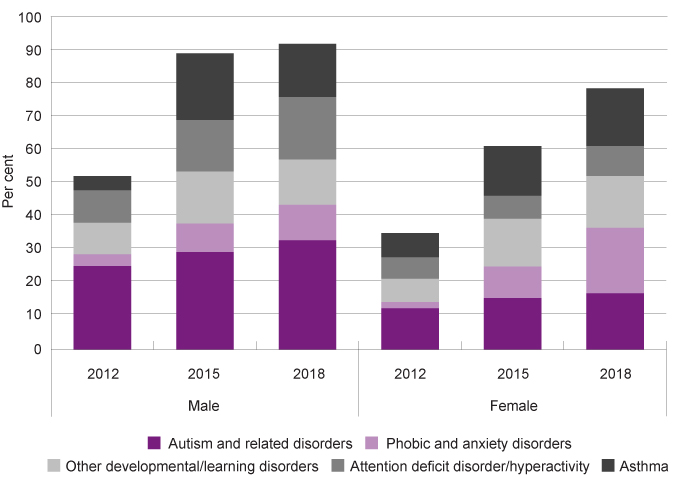
Source: Australian Bureau of Statistics, Disability, Ageing and Carers, Australia, 2018: Table 4.3: Children aged 0-14 years with disability, living in households, Long-term health condition by Sex - 2012, 2015, 2018, Proportion of persons (and previous years’ tables)
Note: Children and young people may have more than one long-term health condition 2012, 2015, 2018, Proportion of persons
Male children and young people are more likely than female children and young people to be diagnosed with autism and ADHD (and related disorders), while female children and young people are more likely to have anxiety related disorders.
In recent years there has been recognition that the diagnosis of some behavioural conditions, particularly autism and ADHD, can be biased towards symptoms experienced by male children and young people, while female children and young people’s symptoms are not always recognised or identified correctly.8,9,10
The data from the Disability, Ageing and Carers Survey is generally collected from parents and carers asking them about their child’s disability status and any activity limitations or restrictions. It is possible that young people have activity limitations which parents are unaware of. Asking young people whether they feel they may experience disability is important.
In 2019, the Commissioner conducted the Speaking Out Survey which sought the views of a broadly representative sample of 4,912 Year 4 to Year 12 students in WA on factors influencing their wellbeing.11 This survey was conducted across mainstream schools in WA; special schools for students with disability were not included in the sample. Therefore, the data is observational and not representative of children and young people with disability, more broadly.
In this survey, Year 7 to Year 12 students were asked: Do you have any long-term disability (lasting 6 months or more) (e.g. sensory impaired hearing, visual impairment, in a wheelchair, learning difficulties)? In total, 315 (11.4%) participating Year 7 to Year 12 students answered yes to this question. Further, 6.6 per cent of participating Year 7 to Year 12 students answered ‘I don’t know’ to this question, which highlights that a significant proportion of high school students feel uncertain about their health and capabilities.12
The WA Department of Health published the Burden of Disease in Western Australia, 2015 reporting on the leading causes of disease in WA children and young people.13 In this collection, asthma, anxiety disorders, depressive disorders and conduct disorders were in the top four causes of disease burden for both male and female children and young people aged five to 14 years.14
For 15 to 24-year old young people the leading causes of the total burden were suicide and self-inflicted injuries, mental disorders and road-traffic injuries. With suicide and self-inflicted injuries the leading cause for male young people and anxiety disorders for female young people.15
One preventable condition that impacts an unknown number of WA children and young people is Fetal Alcohol Spectrum Disorders (FASD) which is a "hidden” disability, and easily confused with disobedience or other conditions such as Attention Deficit Hyperactivity Disorder (ADHD).16 FASD is an umbrella term which covers a range of possible birth defects and/or developmental disabilities that can be caused by exposure to alcohol prior to birth. It has a significant impact on mental health and increases the likelihood of social and emotional behavioural issues throughout life.17,18
The diagnosis of FASD is complex and until 2016 there was not an Australian diagnostic tool for practitioners.19 As such, FASD is a condition that is under-recognised in Australia and often goes undiagnosed.20 In 2016, The Australian Guide to the diagnosis of Fetal Alcohol Spectrum Disorder (FASD) was released which provides health professionals with the tools necessary to diagnose FASD.21
It is generally recognised that many children and young people in out-of-home care and in contact with youth justice services are living with undetected FASD.22 In 2017, a Telethon Kids Institute research team found that 89 per cent (88 young people) of young people in WA’s Banksia Hill Detention Centre had at least one form of severe neurodevelopmental impairment, while 36 per cent (36 young people) were found to have FASD. It is of significant concern that only two of the young people with FASD had been diagnosed prior to participation in the study.23
In the 2019 report, Inquest into the deaths of: Thirteen children and young persons in the Kimberley region, the WA State Coroner noted that a number of the children and young people were likely to have been on the spectrum for FASD, but that none had been formally diagnosed.24
Aboriginal young people
There is limited robust data on the prevalence of disability among WA Aboriginal young people. This is principally due to a lack of adequate sample size for Aboriginal populations in general surveys and these surveys are often not tailored to incorporate Aboriginal cultures and perspectives on health and wellbeing.25
Furthermore, Aboriginal children and young people can be more likely than non-Aboriginal children and young people to be under-diagnosed for disability or long-term health conditions.26,27,28
The Western Australian Aboriginal Child Health Survey (WAACHS) was a comprehensive cross-sectional study of the health and development of a representative random sample of 5,300 Aboriginal and Torres Strait Islander children and young people aged 0 to 17 years living in 2,000 families across WA, including remote areas.29 The study was conducted in 2000-2001 and has not been repeated.
The WAACHS asked questions about restrictions to WA Aboriginal children and young people’s core activities that included self-care, mobility and communication.30 While the data is not recent and the authors recognised limitations, in general the findings suggested that rates of disability among Aboriginal children were similar to those reported in the non-Aboriginal population.31
However, more recent data from the ABS 2015 Survey of Disability, Ageing and Carers reports that Aboriginal children and young people across Australia are more likely to experience disability than non-Aboriginal children and young people.32
|
Aboriginal |
Non-Aboriginal |
|
|
Profound/severe core activity limitation |
5.9 |
3.9 |
|
Moderate/mild core activity limitation |
4.1 |
1.5 |
|
Schooling or employment restriction only |
2.1* |
0.9 |
|
All with specific restrictions |
11.0 |
6.3 |
|
Has disability but no specific restriction |
2.6* |
0.9 |
|
All with reported disability |
13.8 |
7.2 |
|
No reported disability |
86.8 |
92.9 |
Source: Australian Bureau of Statistics, 44300: Survey of Disability Ageing and Carers: Aboriginal and Torres Strait Islander People with Disability, 2015, Table 2.3 All persons living in households, Indigenous Status by Disability Status, Sex and Age – 2015, Proportions
* Estimate has a relative standard error of 25 per cent to 50 per cent and should be used with caution.
This data is not available for WA and there is no further breakdown by age group.
The 2018 Survey of Disability, Ageing and Carers did not provide data on Aboriginal children.
There are a range of intersecting social factors that may contribute to the potentially higher prevalence of disability in Aboriginal communities. These can include poverty, low birth weight, poor access to quality primary health care and high levels of alcohol consumption by some mothers during pregnancy.33
Furthermore, differences between Aboriginal and non-Aboriginal people’s conceptualisations of disability may impact identification, diagnosis and treatment. In addition, information may not be available in community languages, culturally appropriate services may not be available and Aboriginal families are more likely to mistrust government organisations due to the legacy of the stolen generations.34
Endnotes
- Australian Institute of Health and Welfare (AIHW) 2015, Chronic conditions and disability, AIHW.
- Australian Institute of Health and Welfare (AIHW) 2005, Selected chronic diseases among Australia’s children, AIHW.
- Data is sourced from a custom report provided to the Commissioner for Children and Young People WA by the Australian Bureau of Statistics based on the 2018 Disability, Ageing and Carers survey. The ABS uses the following definition of disability: ‘In the context of health experience, the International Classification of Functioning, Disability and Health (ICFDH) defines disability as an umbrella term for impairments, activity limitations and participation restrictions. In this survey, a person has a disability if they report they have a limitation, restriction or impairment, which has lasted, or is likely to last, for at least six months and restricts everyday activities’. Australian Bureau of Statistics 2019, Disability, Ageing and Carers, Australia, 2018, Glossary.
- Australian Bureau of Statistics (ABS) 2016, Disability, Ageing and Carers, Australia: Summary of Findings 2015, ABS.
- Australian Bureau of Statistics 2013, Australian Social Trends: 2012, Children with a disability, ABS catalogue no. 4102.0, Commonwealth of Australia, p. 3.
- Australian Bureau of Statistics 2020, Disability, Ageing and Carers, Australia: Summary of Findings, 2018: Children with Disability, ABS.
- Australian Bureau of Statistics 2013, Australian Social Trends: 2012, Children with a disability, ABS catalogue no. 4102.0, Commonwealth of Australia, p. 3-4 and Australian Bureau of Statistics 2020, Disability, Ageing and Carers, Australia: Summary of Findings, 2018: Children with Disability, ABS.
- Young H 2018, Clinical characteristics and problems diagnosing autism spectrum disorder in girls, Archives de Pédiatrie, Vol 25, No 6.
- Nussbaum NL 2012, ADHD and female specific concerns: a review of the literature and clinical implications, Journal of Attention Disorders, Vol 16, No 2.
- Walters A 2018, Girls with ADHD: Underdiagnosed and untreated, The Brown University Child and Adolescent Behavior Letter, Vol 34, No 11.
- Commissioner for Children and Young People WA 2020, Speaking Out Survey: The views of WA children and young people on their wellbeing - a summary report, Commissioner for Children and Young People WA.
- Commissioner for Children and Young People WA 2020, Speaking Out Survey: The views of WA children and young people on their wellbeing - a summary report, Commissioner for Children and Young People WA.
- Burden of disease measures the gap between current health and ideal health situations in the population. While one disease may be responsible for considerable loss of life due to early death, another may cause significant loss from disability. The total burden, Disability Adjusted Life Years (DALY) combines both premature deaths (YLL) and disability (YLD) into a single measure. Source: WA Department of Health 2020, Western Australian Burden of Disease Study 2015, WA Government.
- WA Department of Health 2020, Western Australian Burden of Disease Study 2015, WA Government.
- Ibid.
- McLean S and McDougall S 2014, Fetal alcohol spectrum disorders: Current issues in awareness, prevention and intervention, CFCA Paper No 20, Child Family Community Australia (CFCA).
- Brown J et al 2018, Fetal Alcohol spectrum disorder (FASD): A beginner’s guide for mental health professionals, Journal of Neurological Clinical Neuroscience, Vol 2, No 1.
- Pei J et al 2011, Mental health issues in fetal alcohol spectrum disorder, Journal Of Mental Health, Vol 20, No 5, pp. 438–448.
- Bower C and Elliott EJ on behalf of the Steering Group 2016, Australian Guide to the diagnosis of Fetal Alcohol Spectrum Disorder (FASD), Telethon Kids Institute and University of Sydney, p. 4.
- Bower C and Elliott EJ 2016, on behalf of the Steering Group, Australian Guide to the diagnosis of Fetal Alcohol Spectrum Disorder (FASD), Telethon Kids Institute and University of Sydney.
- Ibid.
- McLean S and McDougall S 2014, Fetal alcohol spectrum disorders: Current issues in awareness, prevention and intervention, CFCA Paper No 20, Child Family Community Australia (CFCA).
- Bower C et al 2018, Fetal alcohol spectrum disorder and youth justice: a prevalence study amount young people sentenced to detention in Western Australia, BMJ Open, Vol 8, No 2.
- WA State Coroner 2019, Inquest into the deaths of: Thirteen children and young persons in the Kimberley region, Western Australia, WA Government, p. 256.
- Zubrick SR et al 2004, The Western Australian Aboriginal Child Health Survey: The Health of Aboriginal Children and Young People, Telethon Institute for Child Health Research, p.157.
- Bailey B and Arciuli J 2020, Indigenous Australians with autism: A scoping review, autism, Vol 24, No 5.
- Bower C et al 2018, Fetal alcohol spectrum disorder and youth justice: a prevalence study amount young people sentenced to detention in Western Australia, BMJ Open, Vol 8, No 2.
- Di Pietro N and Illes J 2016, Closing Gaps: Strength-Based Approaches to Research with Aboriginal Children with Neurodevelopmental Disorders, Neuroethics, Vol 9.
- Telethon uses the following definition of level of remote isolation (LORI) ‘LORI allows greater discrimination of the circumstances of survey respondents with respect to their isolation from population centres of various sizes and better differentiates between areas and communities that are extremely remote from major metropolitan centres’ Zubrick SR et al 2004, The Western Australian Aboriginal Child Health Survey: The Health of Aboriginal Children and Young People, Telethon Institute for Child Health Research, p.3.
- Ibid, p.157.
- Ibid, p.157.
- To identify whether a child or young person has a particular type of limitation or restriction, the survey collects information on need for assistance, difficulty experienced, and use of aids or equipment to perform selected tasks from the parent/carer (source: ABS - Explanatory Notes).
- National Institute of Health and Welfare, Aboriginal and Torres Strait Islander: Health Performance Framework Report, 1.14 Disability, Australian Government [website].
- DiGiacomo M et al 2013, Childhood disability in Aboriginal and Torres Strait Islander peoples: a literature review, International Journal for Equity in Health, Vol 12, No 7.
Last updated August 2021
At 30 June 2021, there were 1,902 WA young people in care aged between 12 and 17 years, more than one-half of whom (54.0%) were Aboriginal.1
Young people in care have a higher prevalence of chronic and complex physical, neurological and developmental conditions compared to the average young person in Australia.2 It is therefore critical that young people in the care of the state are provided with timely and comprehensive assessments of any health issues and services to meet those issues.
It is a requirement of the WA Department of Communities that children in care receive an initial medical examination within 20 days of entering care and then annual health assessments.3
In 2016, the WA Department for Child Protection (now Department of Communities) published the Outcomes Framework for Children in Out-of-Home Care 2015-16 Baseline Indicator Report. The outcomes framework identified two indicators related to reviewing the physical health of children and young people in out-of-home care.
The first indicator was the ‘proportion of children who had an initial medical examination when entering out-of-home care’. In 2015, 53.1 per cent of children and young people entering out-of-home care had an initial medical examination.4
The second indicator was the ‘proportion of children who had an annual health check of their physical development.’ In this report the Department noted that there were limitations in data accuracy which prevented reporting on this indicator in 2015–16, however data would be reported in 2016–17.5 No data has been reported on this indicator as at publication date.
There is no data available on the physical activity levels, diet or weight of young people in out-of-home care in WA.
The lack of up-to-date data on the health of young people in care and the low proportion of children and young people provided with an initial medical examination in 2015–16 needs to be urgently addressed.
Endnotes
- Department of Communities 2021, Custom report provided by Department of Communities, WA Government [unpublished].
- Nathanson D and Tzioumi D 2007, Health needs of Australian children living in out of home care, Journal of Paediatric Child Health, Vol 43.
- Department for Child Protection and Family Support (Communities), Casework Practice Manual: Health care Planning, WA Government.
- Department for Child Protection and Family Support 2016, Outcomes Framework for Children in Out-of-Home Care 2015-16 Baseline Indicator Report, p. 5.
- Ibid, p. 10.
Last updated August 2021
Physical health is critical for young people’s current wellbeing and also their future life outcomes. The physical health of young people with disability is often viewed through the lens of their disability and other aspects of health can be overlooked.
There is a complex relationship between physical health and disability, however adults with disability are more likely to have long term chronic health conditions including heart disease, stroke and diabetes.1
Young people with disability who are able to participate in physical activities and have healthy diets are more likely to have better health outcomes over the longer term.2,3
The Australian Bureau of Statistics estimates 14,500 WA young people aged 12 to 17 years (7.9%) had reported disability in 2018.4
In 2019, the Commissioner conducted the Speaking Out Survey which sought the views of a broadly representative sample of 4,912 Year 4 to Year 12 students in WA on factors influencing their wellbeing.5 This survey was conducted across mainstream schools in WA; special schools for students with disability were not included in the sample.
In this survey, Year 7 to Year 12 students were asked: Do you have any long-term disability (lasting 6 months or more) (e.g. sensory impaired hearing, visual impairment, in a wheelchair, learning difficulties)? In total, 315 (11.4%) participating Year 7 to Year 12 students answered yes to this question.6
Due to the relatively small sample size, the following results for students who reported long-term disability are observational and not representative of the full population of students with disability in Years 7 to 12 in WA. Comparisons between participating students with and without disability are therefore not statistically significant. Nevertheless, these results provide an indication of the views and experiences of young people with disability.
In the 2019 Speaking Out Survey students were asked to rate their general health. The majority of students with disability reported their general health was either good (37.2%) or very good (30.8%). Less than one in ten (8.5%) reported their health was excellent.
Young people in Year 7 to Year 12 with disability were more likely to rate their general health less favourably than young people without disability.
|
Young people with disability |
Young people without disability |
|
|
Excellent |
8.5 |
15.2 |
|
Very good |
30.8 |
38.0 |
|
Good |
37.2 |
34.9 |
|
Fair |
19.2 |
10.0 |
|
Poor |
4.4 |
1.8 |
Source: Commissioner for Children and Young People WA 2020, Speaking Out Survey 2019 Data Tables [unpublished]
Most (53.8%) young people with disability reported they cared very much about staying fit and being physically active, while 33.4 per cent cared some and 12.8 per cent cared a little or not at all.
|
Young people with disability |
Young people without disability |
|
|
Very much |
53.8 |
39.7 |
|
Some |
33.4 |
42.9 |
|
A little |
10.8 |
13.1 |
|
Not at all |
2.0 |
4.3 |
Source: Commissioner for Children and Young People WA 2020, Speaking Out Survey 2019 Data Tables [unpublished]
Young people with disability were less likely than young people without disability to spend time practising or playing a sport (like footy training, gymnastics, swimming) outside of school.
|
Young people with disability |
Young people without disability |
|
|
Every day or almost every day |
19.6 |
33.5 |
|
Once or twice a week |
30.2 |
32.1 |
|
Less than once a week |
9.0 |
9.3 |
|
Hardly ever or never |
37.7 |
22.3 |
|
I don't know |
3.5 |
2.8 |
Source: Commissioner for Children and Young People WA 2020, Speaking Out Survey 2019 Data Tables [unpublished]
While in some instances disability can limit physical activities, in the Commissioner’s consultations, children and young people with disability highlighted that they want to play sport or do other activities, but there is limited access to activities including sports and other community activities outside of school.7
In 2006, the Physical Activity Study of Children and Adolescents with a Disability (PASCAD) was conducted to examine the physical activity of children/adolescents with a disability in metropolitan Perth. This study found that the majority of children and young people with a disability were not meeting the recommended physical activity guidelines. They also found that children and young people with disability participated in a narrower range of activities with very low participation rate in community-based team/group activities being the most noticeable difference.8
The children and young people in this study, identified social barriers as one of the main obstacles to their physical activity. They reported that non-disabled peers and organisations did not know how to include them in physical activities.9
This study has not been repeated.
The Speaking Out Survey data suggests that young people with disability are marginally more likely to engage in screen-based activities. In particular, a higher proportion of young people with disability than without disability play electronic games every day or almost every day (50.2% with disability, 39.0% without disability).10
Young people with disability are less likely than young people without disability to care very much about eating healthy food (23.6% compared to 35.1%).
|
Young people with disability |
Young people without disability |
|
|
Very much |
23.6 |
35.1 |
|
Some |
54.1 |
49.0 |
|
A little |
19.2 |
13.7 |
|
Not at all |
3.1 |
2.2 |
Source: Commissioner for Children and Young People WA 2020, Speaking Out Survey 2019 Data Tables [unpublished]
Young people with disability are less likely than young people without disability to feel they are the right weight (41.5% without disability compared to 55.3% with disability), while young people with disability were no more or less likely to worry about their weight.11
Endnotes
- Australian Institute of Health and Welfare (AIHW) 2018, Chronic conditions and disability 2015, Cat no CDK 8, AIHW.
- Heller T et al 2011, Physical Activity and Nutrition Health Promotion Interventions: What is Working for People With Intellectual Disabilities?, Intellectual and Developmental Disabilities Vol 49, No 1.
- Australian Institute of Health and Welfare (AIHW) 2018, Chronic conditions and disability 2015, Cat no CDK 8, AIHW, p. 21.
- Data is sourced from a custom report provided to the Commissioner for Children and Young People WA by the Australian Bureau of Statistics based on the 2018 Disability, Ageing and Carers survey. The ABS uses the following definition of disability: ‘In the context of health experience, the International Classification of Functioning, Disability and Health (ICFDH) defines disability as an umbrella term for impairments, activity limitations and participation restrictions. In this survey, a person has a disability if they report they have a limitation, restriction or impairment, which has lasted, or is likely to last, for at least six months and restricts everyday activities’. Australian Bureau of Statistics 2019, Disability, Ageing and Carers, Australia, 2018, Glossary.
- Commissioner for Children and Young People WA 2020, Speaking Out Survey: The views of WA children and young people on their wellbeing - a summary report, Commissioner for Children and Young People WA.
- Commissioner for Children and Young People WA 2020, Speaking Out Survey: The views of WA children and young people on their wellbeing - a summary report, Commissioner for Children and Young People WA.
- Commissioner for Children and Young People 2013, Speaking Out About Disability: The views of Western Australian children and young people with disability, Commissioner for Children and Young People WA.
- Packer TL et al 2006, The Physical Activity Study of Children and Adolescents with a Disability, Curtin University of Technology.
- Ibid.
- Commissioner for Children and Young People WA 2020, Speaking Out Survey Data Tables 2019, Commissioner for Children and Young People WA [unpublished].
- Ibid.
Last updated August 2021
Most young people in WA are healthy, however a significant proportion of young people are not consistently engaging in healthy activities such as regular physical exercise, eating a healthy diet and limiting their screen time. This increases their risk of health issues during adolescence and into adulthood.
Available data suggests that most WA young people aged 10 to 15 years are not meeting the recommended physical activity guidelines and female young people are less likely to meet the physical activity recommendations than their male peers. Additionally, only a very small proportion (less than 10%) of WA children aged four to 15 years are meeting the recommended guidelines for vegetable consumption. At the same time, while there is limited data on sugar consumption in this age group, it is important to reduce the amount of sugar in all young people’s diets.
Many young people who have participated in the Commissioner’s various consultations have identified sport, exercise and fitness as among the things that mattered most to them. They also discussed some of the barriers to getting involved in sporting activities that happened outside of school, including transportation, financial costs, inadequate facilities and equipment, a lack of role models, geographic isolation, parental restrictions and study.1
Research also highlights that individual-level barriers have been found to significantly contribute to a decline in involvement in physical activity for adolescents. Individual-level barriers include young people’s belief they are not good at sport, they do not have enough time for physical activity and that they do not enjoy it.2
For a variety of reasons, including socio-economic disadvantage, Aboriginal young people are at greater risk of having physical health issues, including obesity, over their lifetime which contributes to a higher risk of chronic disease. Life expectancy is 13.4 years lower for WA Aboriginal men, and 12.0 years lower for WA Aboriginal women than other non-Aboriginal WA adults.3 The difference in life expectancy is largely due to a higher incidence of chronic diseases, including heart disease, diabetes and various cancers.4
Socio-economic disadvantage, including parental income levels, education and access to health services have a significant influence on young people’s health.5 The data supports this, as Aboriginal people living in the most disadvantaged areas - a higher proportion of whom were living in remote areas - have the lowest life expectancy.6
WA Department of Health’s strategy to improve health outcomes for Aboriginal children and young people is encompassed in its WA Aboriginal Health and Wellbeing Framework 2015-2030.
Improving the physical health of young people in WA will require multifaceted interventions where evidence-based community level programs are combined with population-level strategies. Some key policy strategies include:7
- policies and programs which improve and promote access to recreational physical activity, including the creation of more community-based environments that provide space for accessible recreational activity and improved transport options, such as bike paths
- supporting all young people, including those with disability and living in regional or remote areas, to participate in organised sport and other recreational activities
- policies and programs to ensure all young people have access to adequate and sustainable supply of affordable, healthy, nutritious food
- limiting the availability and appeal of unhealthy food and beverages through marketing regulations and taxation policies
- programs and policies, including education and information campaigns to inform and support parents and carers to maximise health, physical activity, good nutrition and limiting screen time for children and young people
- programs, guidelines and infrastructure to enable schools to support regular physical activity and healthy eating
- broad strategies that address the social determinants of health including poverty and disadvantage.
While data shows rates of being overweight and obese are increasing for some age groups, there is also considerable pressure to strive for unattainable and unrealistic body images which can encourage body dissatisfaction and unhealthy eating behaviours.8
Problematic eating behaviours such as restrictive dieting and skipping meals can increase risk of the development of an eating disorder. Eating disorders which develop in adolescence can become a chronic problem affecting health and quality of life across the life span. It is important to intervene early to promote healthy eating and nutrition in order to reduce the potential for these behaviours to occur.9
Policies which aim to address rates of overweight and obese children must be formulated in ways which are sensitive and safe and give serious consideration to potentially harmful impacts on future self-esteem and body image.10,11
Data Gaps
The WA Department of Health, Health and Wellbeing of Children in Western Australia survey which collects data on physical activity, sedentary behaviour, diet and healthy weight for WA’s children and young people does not separately report on young people aged 16 to 17 years. As highlighted in the Healthy weight measure, some young people in this age group have a high likelihood of being obese and overweight and collecting and reporting data on their health behaviours is important.
More information is needed on the prevalence of Fetal Alcohol Spectrum Disorders (FASD) in Australia and greater awareness and knowledge of FASD in healthcare and family services is necessary to ensure young people are properly diagnosed and receive services and support as early as possible.
There is limited data on WA Aboriginal children and young people’s physical health. In 2001 and 2002 the Telethon Institute for Child Health Research (now Telethon Kids Institute) conducted the Western Australian Aboriginal Child Health Survey. Telethon Kids Institute are undertaking a follow-up project to this survey which will analyse outcomes for the children and families surveyed.
The Australian Bureau of Statistics conducted the National Aboriginal and Torres Strait Islander Nutrition and Physical Activity Survey (NATSINPAS) in 2011-2013. This survey provided limited data broken down by Australian jurisdiction or for children and young people. The Commissioner’s Speaking Out Survey provides some current insights into Aboriginal children and young people’s health, however more targeted research is needed.
The lack of data on WA Aboriginal young people’s health is a significant gap considering the poorer health outcomes experienced by Aboriginal peoples compared to non-Aboriginal peoples.12
The limited data being collected and reported on the physical health of WA children and young people in out-of-home care is of concern. That only 53.1 per cent of children and young people entering out-of-home care had an initial medical examination in 2015 and the lack of publicly available data makes it difficult to assess whether this issue has been remediated.
There is very limited data available on the health of young people with disability. The Australian Bureau of Statistics Disability, Ageing and Carers survey is conducted every three years, however does not always provide detailed data on children and young people in WA.
Endnotes
- Commissioner for Children and Young People 2018, Policy Brief March 2018: Recreation, Commissioner for Children and Young People WA.
- Jongenelis M et al 2017, Physical activity and screen-based recreation: Prevalence’s and trends over time among adolescents and barriers to recommended engagement, Preventive Medicine, Vol 106, p. 70
- Australian Bureau of Statistics (ABS) 2018, Life Tables for Aboriginal and Torres Strait Islander Australians, 2015-2017, ABS.
- Australian Institute of Health and Welfare (AIHW) 2010, Contribution of chronic disease to the gap in adult mortality between Aboriginal and Torres Strait Islander and other Australians, Cat No IHW 48, AIHW.
- Australian Institute of Health and Welfare (AIHW) 2017, Australia’s Health 2016: 4.2 Social determinants of Indigenous health, AIHW.
- Australian Bureau of Statistics (ABS) 2018, Life Tables for Aboriginal and Torres Strait Islander Australians, 2015-2017, ABS.
- For more information refer: Preventative Health Taskforce 2008, Australia: The Healthiest Country by 2020: A discussion paper prepared by the National Preventative Health Taskforce and Public Health Advocacy Institute of WA, Obesity [website].
- O’Connor M et al 2017, Eating problems in mid-adolescence, in The Longitudinal Study of Australian Children Annual Statistical Report 2017, Australian Institute of Family Studies, p. 113.
- Ibid, p. 113.
- Russell-Mayhew S 2012, Mental Health, Wellness, and Childhood Overweight/Obesity, Journal of Obesity, Vol 2012.
- O’Dea JA 2012, Studies of obesity, body image and related health issues among Australian adolescents: how can programs in schools interact with and complement each other?, Journal of Student Wellbeing, Vol 4, No 2.
- Australian Institute of Health and Welfare (AIHW) 2015, The health and welfare of Australia’s Aboriginal and Torres Strait Islander peoples: 2015 – Health and disability key points [website].
For further information on physical health for young people refer to the following resources:
- Active Healthy Kids Australia 2018, Muscular Fitness: It’s Time for a Jump Start. The 2018 Active Healthy Kids Australia Report Card on Physical Activity for Children and Young People, Active Healthy Kids Australia.
- Australian Institute of Health and Welfare 2018, Physical activity across the life stages, Cat no PHE 225, AIHW.
- Child and Adolescent Health Services, Community Health Manual Guideline: Overweight and Obesity, WA Government.
- Commissioner for Children and Young People 2014, Policy Brief November 2014: Obesity, Commissioner for Children and Young People WA.
- Commissioner for Children and Young People 2018, Policy Brief March 2018: Recreation, Commissioner for Children and Young People WA.
- Lee A and Ride K 2018, Review of nutrition among Aboriginal and Torres Strait Islander people, Australian Indigenous HealthInfoNet.
- National Health and Medical Research Council 2013, Australian Dietary Guidelines: Providing the scientific evidence for healthier Australian diets, Canberra, National Health and Medical Research Council.
- WA Department of Sport and Recreation 2015, Brain Boost: how sport and physical activity enhance children’s learning, Centre for Sport and Recreation Research, Curtin University.
- Australian Institute of Health and Welfare (AIHW) 2011, Young Australians: their health and wellbeing 2011, AIHW, p. 1.