


A sense of belonging and supportive relationships at school

Students who feel a sense of belonging at their school and like attending school are more likely to have greater motivation and engagement as well as better academic outcomes.
Last updated June 2020
Good data is available on whether WA young people aged 12 to 17 years are supported and feel like they belong at school.
Overview
Research suggests that a sense of belonging at school and the degree to which students report liking school has an important influence on student motivation, engagement, participation and academic outcomes.1,2
A sense of belonging at school is derived through the school environment, positive and supportive teacher and peer relationships and personal characteristics, such as conscientiousness, optimism and self-esteem.3
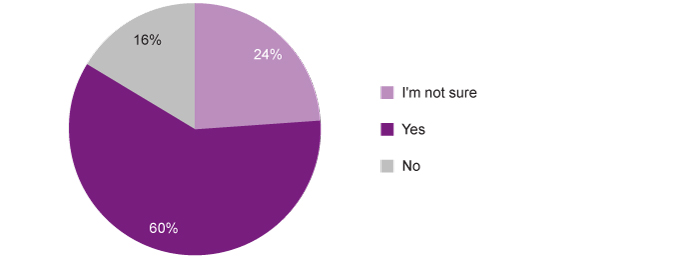
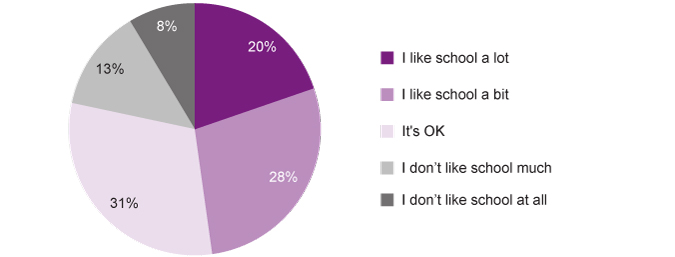
In the Commissioner’s Speaking Out Survey 2019,4 one-half of respondents in Year 7 to Year 12 reported liking school a lot or a bit (48.0%) and the majority reported feeling like they belong to their school (59.7%).
Proportion of Year 7 to Year 12 students saying they feel like they do or don’t belong to their school or they are unsure, per cent, WA, 2019
Source: Commissioner for Children and Young People, Speaking Out Survey 2019 Data Tables [unpublished]
Aboriginal Year 7 to Year 12 students were more likely than non-Aboriginal students to report it is very much true that there is a teacher who really cares about them (34.6% Aboriginal compared to 23.6% non-Aboriginal).
Areas of concern
One-in-five Year 7 to Year 12 students reported not liking school much or not at all (I don’t like it much: 13.0%, I don’t like it at all: 8.5%). Female students were significantly more likely than male students to not like school at all (10.2% compared to 6.4%).5
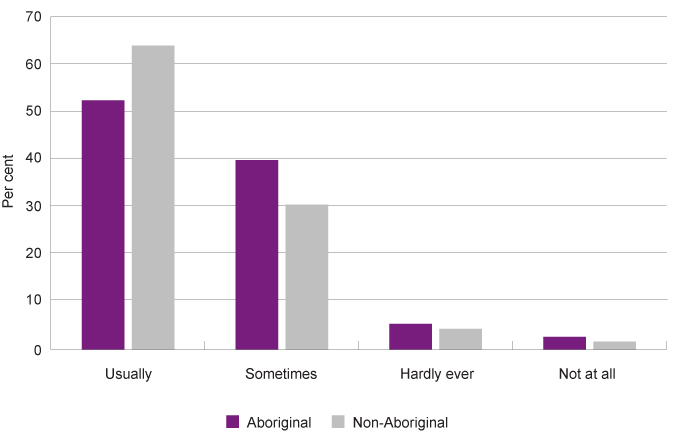
Aboriginal Year 7 to Year 12 students were less likely than non-Aboriginal students to report that they usually get along with their teachers (52.0% compared to 63.4%) or their classmates (62.8% compared to 69.5%).
Almost 20 per cent (19.4%) of Year 7 to Year 12 students reported they feel safe at school only sometimes or less.
Endnotes
- Goodenow C and Grady KE 1993, The Relationship of School Belonging and Friends’ Values to Academic Motivation Among Urban Adolescent Students, The Journal of Experimental Education, Vol 62 No 1, pp. 60-71.
- Ma X 2003, Sense of Belonging to School: Can Schools Make a Difference?, The Journal of Educational Research, Vol 96 No 6, pp. 340-349.
- Allen K et al 2016, What schools need to know about fostering school belonging: a meta-analysis, Educational Psychology Review, pp. 1-34.
- Commissioner for Children and Young People WA 2020, Speaking Out Survey: The views of WA children and young people on their wellbeing - a summary report, Commissioner for Children and Young People WA.
- Commissioner for Children and Young People, Speaking Out Survey 2019 Data Tables, [unpublished].
Last updated June 2020
In 2019, the Commissioner for Children and Young People WA conducted the Speaking Out Survey with Year 7 to Year 12 students from all regions of WA. In this study, one-half of students reported liking school – 20.0 per cent said they like school a lot and 28.0 per cent said they like it a bit. Around one-third (30.6%) felt school was ‘OK’.
One-in-five students reported not liking school – 13.0 per cent said they don’t like school much and 8.5 per cent said they don’t like school at all.
|
Male |
Female |
Metropolitan |
Regional |
Remote |
Total |
|
|
Likes school a lot |
23.2 |
16.8 |
21.1 |
15.0 |
17.3 |
20.0 |
|
Likes school a bit |
30.5 |
26.1 |
27.9 |
29.5 |
25.2 |
28.0 |
|
It's OK |
28.7 |
32.2 |
29.8 |
34.1 |
33.6 |
30.6 |
|
Doesn't like school much |
11.2 |
14.8 |
13.3 |
12.1 |
10.6 |
13.0 |
|
Doesn't like school at all |
6.4 |
10.2 |
8.0 |
9.3 |
13.3 |
8.5 |
Source: Commissioner for Children and Young People, Speaking Out Survey 2019 Data Tables [unpublished]
Proportion of Year 7 to Year 12 students saying they like school a lot, a bit, school is OK, they don't like school much or not at all by selected characteristics, per cent, WA, 2019
Source: Commissioner for Children and Young People, Speaking Out Survey 2019 Data Tables [unpublished]
Large differences were found between the genders with a lower proportion of female than male students reporting they like school (42.9% female compared to 53.7% male) and a lower proportion of male than female students reporting they don’t like school or not much (17.6% male compared to 25.0% female). That is, one-quarter of female Year 7 to Year 12 students do not like school or not much.
Interestingly, this difference between the genders was reversed for students in Years 4 to 6 (refer A sense of belonging and supportive relationships at school for age group 6 to 11 years). The proportion of female students liking school a lot decreased by 27.3 percentage points from 44.1 per cent of Year 4 to Year 6 students to 16.8 per cent of Year 7 to Year 12 students. While the proportion of male students liking school a lot decreased by 17.2 percentage points from 40.4 per cent of Year 4 to Year 6 students to 23.2 per cent of Year 7 to Year 12 students.
Year 7 to Year 12 students in regional areas were least likely to report liking school a lot (15.0%) followed by students in remote and metropolitan areas (17.3% and 21.1%).
|
Aboriginal |
Non-Aboriginal |
|
|
Likes school a lot |
22.2 |
19.9 |
|
Likes school a bit |
21.1 |
28.4 |
|
It's OK |
36.7 |
30.2 |
|
Doesn't like school much |
10.8 |
13.1 |
|
Doesn't like school at all |
9.2 |
8.4 |
Source: Commissioner for Children and Young People, Speaking Out Survey 2019 Data Tables [unpublished]
Similar proportions of Aboriginal and non-Aboriginal students reported liking school a lot (22.2% compared to 19.9%) and also not liking school at all (9.2% compared to 8.4%), these differences are not statistically significant.
The Speaking Out Survey 2019 did not ask students to specify their reasons for not liking school but in an earlier student survey undertaken by the Commissioner in 2016, participating Year 7 to Year 12 students who reported not liking school listed the following most common reasons for not liking school: ‘because it’s boring’ (53.3%), ‘don’t like the way that I’m being taught’ (49.3%) and ‘what I’m learning is not interesting’ (46.7%).1
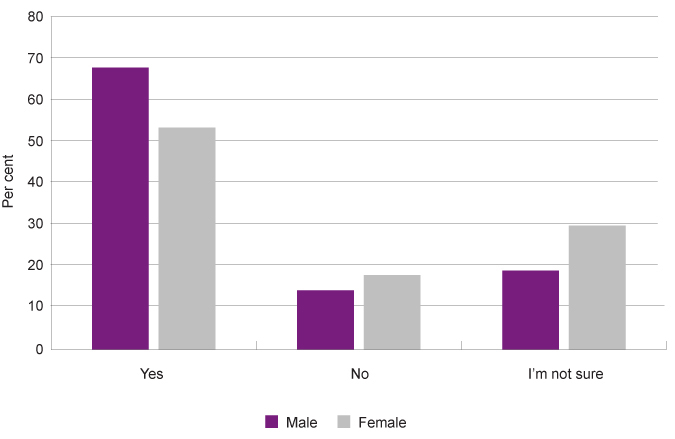
In terms of specifically measuring the sense of belonging, 59.7 per cent of Year 7 to Year 12 students reported they feel like they belong to their school. One-quarter (24.1%) of students said they are not sure they do and 16.1 per cent reported feeling like they don’t belong to their school.2
|
Male |
Female |
Metropolitan |
Regional |
Remote |
Total |
|
|
Yes |
67.2 |
52.9 |
60.5 |
57.0 |
54.9 |
59.7 |
|
No |
14.1 |
17.7 |
15.6 |
17.4 |
21.0 |
16.1 |
|
I'm not sure |
18.8 |
29.5 |
23.9 |
25.6 |
24.1 |
24.1 |
Source: Commissioner for Children and Young People, Speaking Out Survey 2019 Data Tables [unpublished]
Similar to the results for liking school, a significantly lower proportion of female than male Year 7 to Year 12 students reported they feel like they belong at their school (52.9% female compared to 67.2% male). Almost 30 per cent (29.5%) of female students reported they were not sure if they felt like they belonged at their school.
Proportion of Year 7 to Year 12 students saying they feel like they belong at their school by gender, per cent, WA, 2019
Source: Commissioner for Children and Young People, Speaking Out Survey 2019 Data Tables [unpublished]
There was no difference in feelings of belonging between Aboriginal and non-Aboriginal Year 7 to Year 12 students (Aboriginal: 60.5% feel like they belong, non-Aboriginal: 59.7% feel like they belong).
Results from the Speaking Out Survey 2019 highlight that some students, and especially female students, experience a significant decline in their life satisfaction and sense of wellbeing as they transition from primary school to high school.3 Further in-depth analysis and exploration of these results will be carried out in 2020 to better understand the factors influencing these changes in wellbeing.
In the 2016 School and Learning Consultation, participating Year 7 to Year 12 students who said they feel like they are part of their school were more likely than other students to say that they:
-
enjoy school ‘a lot’ or ‘a bit’
-
‘usually’ get along with their classmates
-
feel safe at school ‘all the time’ or ‘most of the time’.
When asked about what makes students feel like they are part of their school, the most commonly mentioned reasons were ‘friends’, ‘teachers’ or particular activities and subjects offered by the school.4
For more information on young people’s views reported through the School and Learning Consultation, see the Commissioner’s 2018 report, Speaking Out About School and Learning.
For more information on young people’s views reported through the Speaking Out Survey, see the Commissioner’s 2020 report, Speaking Out Survey 2019 – a summary report.
National School Opinion Survey
All WA government schools are required to administer parent, student and staff National School Opinion Surveys (NSOS) at least every two years, commencing in 2014. The Australian Curriculum Assessment and Reporting Authority (ACARA) was responsible for the development and implementation of the NSOS. The WA Department of Education and individual schools can add extra questions to the survey.
In WA, the first complete (although non-mandatory) implementation of the survey was conducted in government schools in 2016. The next survey was conducted in 2018 and the results will be published when available.
In the 2016 survey, 56.4 per cent of Year 7 to Year 12 students in government schools either agreed or strongly agreed with the statement ‘I like being at school’. Twenty-three per cent neither agreed nor disagreed, while 18.5 per cent disagreed or strongly disagreed. This represents a significant drop from the results for primary schools where 80.0 per cent of Year 5 to Year 6 students agreed or strongly agreed with this statement.5
Taking into account the different research methodologies and questions used between the NSOS and the Speaking Out Survey, the responses are relatively consistent.
PISA Sense of Belonging Index
The sense of belonging of students at 15 years of age was measured in the Programme for International Student Assessment (PISA) in 2003, 2012 and 2015. The PISA sense of belonging index was based on responses to six statements related to sense of belonging and feeling accepted by peers. Refer to the PISA Australia in Focus Number 1: Sense of belonging at school for more information on the methodology.
In the 2015 PISA survey, 78.0 per cent of students in WA agreed that they ‘make friends easily at school’, which is consistent with the OECD average and similar to the Australian average (79.0%). Yet, only 70.0 per cent of WA students agreed that they ‘feel like I belong at school’. The OECD average was 73 per cent and the Australian average was 72.0 per cent.6
Australia-wide, 64.0 per cent of Aboriginal students agreed that they ‘feel like I belong at school’, compared to 72.0 per cent of non-Aboriginal students. Further, there was a significant difference between the responses of students from lower socio-economic backgrounds compared to those from higher socio-economic backgrounds and equivalent differences by remoteness (fewer students felt a sense of belonging at school in remote locations).7
Across all measures, there has been a negative trend in the sense of belonging at school of Australian students over time. In 2003, 91.0 per cent of Australian students agreed that they make friends easily at school, and by 2015 this percentage decreased to 79.0 per cent. In 2003, 88.0 per cent of Australian students agreed that they feel like they belong at school, and by 2015 this decreased to 72.0 per cent.8 This level of decline was relatively consistent across the English-speaking countries measured.
These negative trends were generally greater for female students, Aboriginal students and students in the lowest socio-economic quartile.
- Commissioner for Children and Young People 2018, School and Learning Consultation: Technical Report, Commissioner for Children and Young People WA, p. 34
- Commissioner for Children and Young People WA 2020, Speaking Out Survey: The views of WA children and young people on their wellbeing - a summary report, Commissioner for Children and Young People WA, p. 93
- Ibid, p. 3.
- Commissioner for Children and Young People 2018, School and Learning Consultation: Technical Report, Commissioner for Children and Young People WA, p. 34-35
- Results from the National School Opinion Survey 2016, custom report prepared by WA Department of Education for the Commissioner for Children and Young People WA. The data should be interpreted with caution as the survey is relatively new and there is a consequent lack of an agreed baseline.
- Australian Council for Education Research (ACER) 2018, PISA Australia in Focus Number 1: Sense of belonging at school, Camberwell, Australian Council for Education Research Ltd, p. 17.
- Ibid, p. 20.
- Ibid, p. 21.
Last updated June 2020
Quality interpersonal relationships have been identified through the Commissioner’s School and Learning Consultation as the foundation for student engagement with school and in learning activities.1 Relationships with peers, teachers and other school staff foster in students a sense of belonging and of feeling valued. Through relationships, students are more likely to develop patterns of persistence, motivation and resilience, and have access to a support network.2,3
Relationships with peers
In the Commissioner's Speaking Out Survey 2019, 69.2 per cent of Year 7 to Year 12 students reported usually getting along with their classmates while almost 25.3 per cent said that they get along sometimes. Almost five per cent (4.6%) of students reported getting along with classmates hardly ever or not at all.
|
Male |
Female |
Metropolitan |
Regional |
Remote |
Total |
|
|
Usually |
72.3 |
66.8 |
70.2 |
66.4 |
60.8 |
69.2 |
|
Sometimes |
22.8 |
27.3 |
24.5 |
27.2 |
32.8 |
25.3 |
|
Hardly ever |
2.7 |
3.3 |
2.9 |
3.1 |
3.5 |
3.0 |
|
Not at all |
1.5 |
1.6 |
1.6 |
1.7 |
2.4 |
1.6 |
|
Prefer not to say |
0.8 |
0.9 |
0.8 |
1.5 |
N/A |
0.9 |
Source: Commissioner for Children and Young People, Speaking Out Survey 2019 Data Tables [unpublished]
N/A – Cells are suppressed where the number of students providing data for that response was less than 5.
Female students were less likely than male students to report usually getting along with classmates (66.8% compared to 72.3%) and more likely to report getting along sometimes (27.3% compared to 22.8%). Largely equal proportions of male and female students reported not getting along with classmates.
Year 7 to Year 12 students in remote areas were least likely to report usually getting along with classmates (60.8%) followed by students in regional and metropolitan areas (66.4% and 70.2%). These differences are not statistically significant.
|
Aboriginal |
Non-Aboriginal |
|
|
Usually |
62.8 |
69.5 |
|
Sometimes |
28.8 |
25.1 |
|
Hardly ever |
3.6 |
3.0 |
|
Not at all |
3.2 |
1.6 |
|
Prefer not to say |
1.6 |
0.8 |
Source: Commissioner for Children and Young People, Speaking Out Survey 2019 Data Tables [unpublished]
A lower proportion of Aboriginal than non-Aboriginal students reported usually getting along with classmates (62.8% compared to 69.5%) and a greater proportion of Aboriginal students reported getting along hardly ever or not at all (6.8% Aboriginal compared to 4.6% non-Aboriginal), however, these differences were not statistically significant.
Relationships with teachers
Positive relationships between students and teachers have a long-lasting impact and can contribute to students’ academic and social development, enable students to feel safe and secure in their learning environments and promote engagement with school and learning.4,5
In the Commissioner’s 2019 survey, around two-thirds (62.7%) of Year 7 to Year 12 students reported usually getting along with their teachers while 30 per cent answered they get along sometimes. Six per cent of students reported getting along with teachers hardly ever (4.3%) or not at all (1.7%).
|
Male |
Female |
Metropolitan |
Regional |
Remote |
All |
|
|
Usually |
62.6 |
63.4 |
63.7 |
58.9 |
58.0 |
62.7 |
|
Sometimes |
30.4 |
30.9 |
30.3 |
31.8 |
33.4 |
30.7 |
|
Hardly ever |
4.8 |
3.8 |
3.9 |
6.0 |
6.3 |
4.3 |
|
Not at all |
1.9 |
1.0 |
1.6 |
2.2 |
2.0 |
1.7 |
|
Prefer not to say |
N/A |
0.9 |
0.5 |
N/A |
N/A |
0.6 |
Source: Commissioner for Children and Young People, Speaking Out Survey 2019 Data Tables [unpublished]
N/A – Cells are suppressed where the number of students providing data for that response was less than 5.
There was largely no difference between the genders with equal proportions of male and female Year 7 to Year 12 students rating their relationships with teachers either positively or negatively. Students in regional and remote areas were somewhat less likely than metropolitan students (regional: 58.9% and remote: 58.0% compared to 63.7%) to report usually getting along with teachers but the differences were not statistically significant.
|
Aboriginal |
Non-Aboriginal |
|
|
Usually |
52.0 |
63.4 |
|
Sometimes |
39.5 |
30.2 |
|
Hardly ever |
5.3 |
4.3 |
|
Not at all |
2.6 |
1.6 |
|
Prefer not to say |
N/A |
0.6 |
Source: Commissioner for Children and Young People, Speaking Out Survey 2019 Data Tables [unpublished]
N/A – Cells are suppressed where the number of students providing data for that response was less than 5.
A significantly lower proportion of Aboriginal than non-Aboriginal students reported usually getting along with teachers (52.0% compared to 63.4%) and a greater proportion of Aboriginal students reported getting along hardly ever or not at all (7.9% Aboriginal compared to 5.9% non-Aboriginal).
Proportion of Year 7 to Year 12 students getting along with teachers usually, sometimes, hardly ever or not at all by Aboriginal status, per cent, WA, 2019
Source: Commissioner for Children and Young People, Speaking Out Survey 2019 Data Tables [unpublished]
With regard to caring teachers, among Year 7 to Year 12 students, 61.5 per cent of students felt it was true that at their school there was a teacher or another adult who really cared about them (very much true: 24.3%, pretty much true: 37.2%). Around 30 per cent (28.8%) said this was a little true and one-in-ten students (9.8%) felt this was not at all true for them.
|
Male |
Female |
Metropolitan |
Regional |
Remote |
Total |
|
|
Very much true |
24.3 |
24.1 |
23.4 |
27.6 |
28.8 |
24.3 |
|
Pretty much true |
39.3 |
35.2 |
37.3 |
38.7 |
31.0 |
37.2 |
|
A little true |
27.7 |
30.0 |
29.1 |
25.5 |
32.8 |
28.8 |
|
Not at all true |
8.7 |
10.7 |
10.3 |
8.1 |
7.4 |
9.8 |
Source: Commissioner for Children and Young People, Speaking Out Survey 2019 Data Tables [unpublished]
Students in regional and remote areas were somewhat more likely than metropolitan students to say it was very much true there is a teacher or another adult who really cares about them (remote: 28.8%, regional: 27.6%, metropolitan: 23.4%). These differences were not statistically significant.
Aboriginal Year 7 to Year 12 students were significantly more likely than non-Aboriginal students to say it was very much true there is a teacher or another adult who really cares about them (34.6% Aboriginal compared to 23.6% non-Aboriginal).
|
Aboriginal |
Non-Aboriginal |
|
|
Very much true |
34.6 |
23.6 |
|
Pretty much true |
33.9 |
37.4 |
|
A little true |
22.0 |
29.2 |
|
Not at all true |
9.5 |
9.8 |
Source: Commissioner for Children and Young People, Speaking Out Survey 2019 Data Tables [unpublished]
Proportion of Year 7 to Year 12 students saying it is very much true, pretty much true, a little true or not at all true that there is a teacher or another adult who really cares about them by Aboriginal status, per cent, WA, 2019
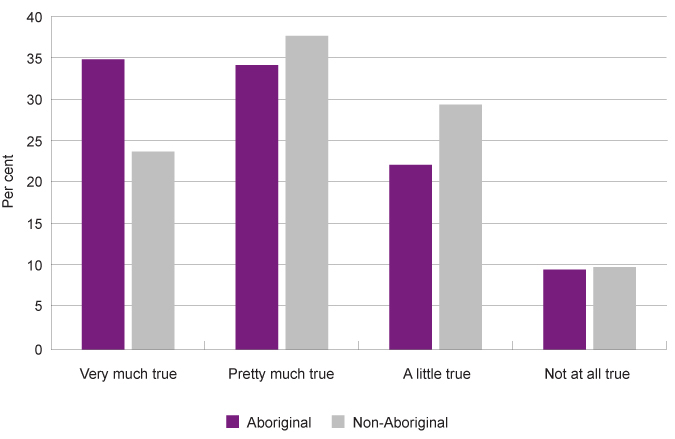
Source: Commissioner for Children and Young People, Speaking Out Survey 2019 Data Tables [unpublished]
It is important to note that a significant negative shift was measured between younger and older students about how much they felt it was true that teachers or another adult at school care about them. While 44.3 per cent of Year 4 to Year 6 students felt this was very much true, only 24.3 per cent of Year 7 to Year 12 students said the same. Conversely, 13.7 per cent of Year 4 to Year 6 students said this was a little true compared to 28.8 per cent of high school students. This is consistent with results of the National School Opinion Survey discussed below.
The Commissioner’s School and Learning Consultation of 2016 found that students who reported usually getting along with teachers and also felt that their teachers cared a lot about them were more likely to like school, feel a sense of belonging, rate their academic achievement higher and perceive attending school regularly as important, than students who said they get along with their teachers sometimes or less and felt that their teachers cared ‘some’.6
National School Opinion Survey
In the 2016 National School Opinion Survey,7 51.0 per cent of participating Year 7 to Year 12 students in WA government schools either agreed or strongly agreed with the statement ‘my teachers care about me’. Twenty-four per cent neither agreed nor disagreed with this, while 12.0 per cent disagreed or strongly disagreed. Consistent with the Speaking Out Survey, this represents a significant decrease from the results for primary schools where 78.0 per cent of Year 5 and Year 6 students agreed or strongly agreed with this statement.
Endnotes
- Commissioner for Children and Young People WA 2018, School and Learning Consultation: Technical Report, Commissioner for Children and Young People WA, p. 45
- Martin A and Dowson M 2009, Interpersonal Relationships, Motivation, Engagement, and Achievement: Yields for Theory, Current Issues, and Educational Practice, Review of Educational Research, Vol 79 No 1, pp. 327-365.
- Cahill H et al 2014, Building Resilience in Children and Young People, A Literature Review for the Department of Education and Early Childhood Development (DEECD), Youth Research Centre, Melbourne Graduate School of Education, University of Melbourne, p. 5
- Berry D and O’Connor E 2010, Behavioural risk, teacher-child relationships, and social skill development across middle childhood: A child-by-environment analysis of change, Journal of Applied Developmental Psychology, Vol 31 No 1, pp. 1-14.
- Hamre B and Pianta R 2001, Early Teacher-Child Relationships and the Trajectory of Children’s School Outcomes through Eighth Grade, Child Development, Vol 72 No 2, pp. 625-638.
- Commissioner for Children and Young People WA 2018, School and Learning Consultation: Technical Report, Commissioner for Children and Young People WA, p. 63
- All WA government schools are required to administer parent, student and staff National School Opinion Surveys (NSOS) at least every two years, commencing in 2014. In WA, the first complete (although non-mandatory) implementation of the survey was conducted in government schools in 2016. The next survey was conducted in 2018 and results will be published when available. The data should be interpreted with caution as the survey is relatively new and there is a consequent lack of an agreed baseline for results.
Last updated June 2020
Within schools, feeling and being safe is essential for students to be ready and able to engage with learning. When students do not feel safe it affects their behaviour and their feelings towards school and learning. Further, evidence suggests that children and young people who feel safe are more resilient, confident and have a stronger sense of identity.1
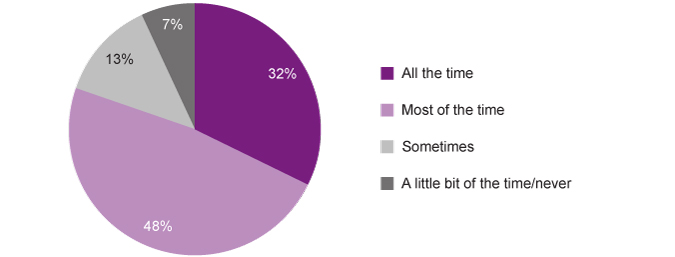
In the Speaking Out Survey 2019, one-third (32.3%) of Year 7 to Year 12 students reported feeling safe at school all the time while almost one-half (47.9%) reported feeling safe most of the time. One-in-five students said they feel safe at school sometimes or less (12.6% sometimes, 4.8% a little bit of the time and 2.0% never).
|
Male |
Female |
Metropolitan |
Regional |
Remote |
All |
|
|
All the time |
36.4 |
28.3 |
31.6 |
37.3 |
29.8 |
32.3 |
|
Most of the time |
46.4 |
49.6 |
49.2 |
40.8 |
47.0 |
47.9 |
|
Sometimes |
11.1 |
13.9 |
12.3 |
13.1 |
14.8 |
12.6 |
|
A little bit of the time |
3.9 |
5.7 |
4.5 |
5.4 |
6.8 |
4.8 |
|
Never |
1.8 |
1.8 |
1.8 |
2.7 |
1.6 |
2.0 |
|
Prefer not to say |
0.4 |
0.6 |
0.5 |
N/A |
N/A |
0.5 |
Source: Commissioner for Children and Young People, Speaking Out Survey 2019 Data Tables [unpublished]
Proportion of Year 7 to Year 12 students reporting they feel safe at school all the time, most of the time, sometimes, a little bit of the time or never, per cent, WA, 2019
Source: Commissioner for Children and Young People, Speaking Out Survey 2019 Data Tables [unpublished]
Female students were less likely than male students to report feeling safe at school all the time (28.3% compared to 36.4%) and somewhat more likely to report feeling safe sometimes or less (21.4% compared to 16.8%).
Students in remote areas were least likely to report feeling safe all the time followed by regional and metropolitan students (29.8% compared to 37.3% and 31.6%). The results did not reach statistical significance due to sample size.
Aboriginal students were somewhat more likely to report feeling safe at school all the time than non-Aboriginal students (36.2% compared to 32.0%). These results were not statistically significant.
|
Aboriginal |
Non-Aboriginal |
|
|
All of the time |
36.2 |
32.0 |
|
Most of the time |
39.9 |
48.4 |
|
Sometimes |
14.7 |
12.5 |
|
A little bit of the time |
4.3 |
4.8 |
|
Never |
3.6 |
1.9 |
|
Prefer not to say |
N/A |
0.4 |
Source: Commissioner for Children and Young People, Speaking Out Survey 2019 Data Tables [unpublished]
National School Opinion Survey
In the 2016 National School Opinion Survey (NSOS), 2 64.0 per cent of participating Year 7 to Year 12 students in government schools either agreed or strongly agreed that they ‘feel safe at school’. Twenty-one per cent neither agreed nor disagreed with this statement, while 13.0 per cent disagreed or strongly disagreed. This represents a significant decrease from the results for primary schools where 81.0 per cent of Year 5 and Year 6 students agreed or strongly agreed that they ‘feel safe at school’.
Bullying at school
In the Commissioner’s consultations, children and young people have said that safety at school is a critical influence on their engagement in education. They referred to various aspects of the school environment as either creating or hindering feelings of safety, including the physical environment, the behaviour of peers and school staff, relationships with others in the school, teaching practices and use/access of the school grounds by community members.3 Children and young people particularly identify bullying as a significant safety concern.4
In the 2019 Speaking Out Survey, 40.9 per cent of Year 7 to Year 12 students reported having ever been bullied, cyber bullied or both at school with an additional 11.2 per cent saying they are not sure or prefer not to say.
|
Male |
Female |
Metropolitan |
Regional |
Remote |
Total |
|
|
No |
53.6 |
42.7 |
49.4 |
40.6 |
43.3 |
47.9 |
|
Yes, bullied |
25.2 |
22.4 |
23.1 |
25.9 |
31.8 |
24.0 |
|
Yes, cyber bullied |
2.0 |
3.7 |
2.8 |
3.9 |
1.2 |
2.9 |
|
Both bullied and cyber bullied |
10.2 |
17.2 |
13.5 |
17.5 |
13.2 |
14.0 |
|
I don't know |
6.8 |
10.8 |
8.4 |
10.2 |
8.5 |
8.6 |
|
Prefer not to say |
2.1 |
3.2 |
2.8 |
1.9 |
1.9 |
2.6 |
Source: Commissioner for Children and Young People, Speaking Out Survey 2019 Data Tables [unpublished]
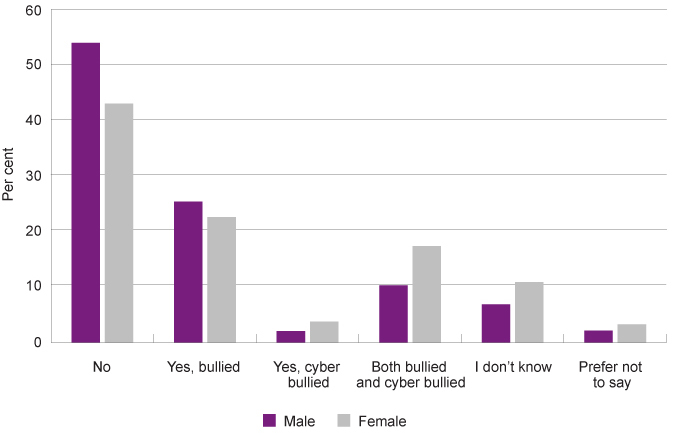
A significantly higher proportion of male than female students in Years 7 to Year 12 reported no experiences of bullying (53.6% compared to 42.7%). Female students were significantly more likely than male students to report having been both bullied and cyber bullied (17.2% compared to 10.2%).
Proportion of Year 7 to Year 12 students reporting they have or have not ever been bullied, cyber bullied or both or they don’t know by gender, per cent, WA, 2019
Source: Commissioner for Children and Young People, Speaking Out Survey 2019 Data Tables [unpublished]
A higher proportion of Aboriginal Year 7 to Year 12 students than non-Aboriginal students reported no experiences of bullying (55.9% compared to 47.4%), although this difference was not statistically significant.5
Of concern is that 21.0 per cent of female students and 10.7 per cent of male students said they had missed school due to being afraid of bullying. The difference between genders is statistically significant.
|
Male |
Female |
Metropolitan |
Regional |
Remote |
Total |
|
|
Never |
86.3 |
72.8 |
80.0 |
74.5 |
80.0 |
79.2 |
|
Yes |
10.7 |
21.0 |
15.8 |
18.6 |
15.6 |
16.2 |
|
Prefer not to say |
3.0 |
6.2 |
4.2 |
6.8 |
4.4 |
4.6 |
Source: Commissioner for Children and Young People, Speaking Out Survey 2019 Data Tables [unpublished]
Proportion of Year 7 to Year 12 students saying they have or have not ever missed school due to being afraid of bullying or they prefer not to say by gender, per cent, WA, 2019
Source: Commissioner for Children and Young People, Speaking Out Survey 2019 Data Tables [unpublished]
Among all students who had ever missed school due to fear of being bullied, one-third (33.0%) reported this had happened in the last month.6
The School and Learning Consultation found that students who feel safe at school are more likely to have positive engagement outcomes (like school a lot, feel like part of their school, say being at school every day is very important, and achieve highly).7
Children and young people’s experiences of cyber bullying are discussed in more detail in the Safe in the community indicator.
The Commissioner’s policy brief, Children and young people speak out about education and safety in schools, provides further information on this topic.
Endnotes
- Australian Research Alliance for Children and Youth (ARACY) 2014, The Nest action agenda: Technical document, ARACY.
- Source: Results from the National School Opinion Survey 2016, custom report prepared by WA Department of Education for Commissioner for Children and Young People WA. All WA government schools are required to administer parent, student and staff National School Opinion Surveys (NSOS) at least every two years, commencing in 2014. The Australian Curriculum Assessment and Reporting Authority (ACARA) was responsible for the development and implementation of the NSOS. The WA Department of Education and individual schools are also able to add additional questions to the survey. In WA, the first complete (although non-mandatory) implementation of the survey was conducted in government schools in 2016. The next survey was conducted in 2018 and will be reported once results are compiled. The data should be interpreted with caution as the survey is relatively new and there is a consequent lack of an agreed baseline for results.
- Commissioner for Children and Young People WA 2018, Policy Brief: Children and young people speak out about education and safety in schools, Commissioner for Children and Young People WA.
- Commissioner for Children and Young People WA 2018, School and Learning Consultation: Technical Report, Commissioner for Children and Young People WA, p. 41.
- Commissioner for Children and Young People WA, Speaking Out Survey 2019 Data Tables, Commissioner for Children and Young People WA [unpublished].
- Ibid.
- Commissioner for Children and Young People 2017, Speaking Out About School and Learning, The views of WA children and young people on factors that support their engagement in school and learning, Commissioner for Children and Young People WA.
Last updated June 2020
For young people to be fully engaged in learning they need to feel recognised, respected and supported in their culture. A term that encompasses this measure is cultural safety which defines ‘an environment that is safe for people: where there is no assault, challenge or denial of their identity, of who they are and what they need. It is about shared respect, shared meaning, shared knowledge and experience, of learning, living and working together with dignity and truly listening’.1
This applies to all students but especially to Aboriginal young people, young people who are culturally and linguistically diverse and Lesbian, Gay, Bisexual, Trans and Intersex (LGBTI) young people.
As understanding increases of the longer-term impacts on children and young people of discrimination and bias through stereotypes, it becomes more critical to collect and report on cultural safety,2 however, at this point in time there is very limited data available on this. Recent studies have reported links between childhood experiences of racial discrimination and health risks over the longer term.3,4
In the 2016 School and Learning Consultation, more than two-thirds (67.4%) of Aboriginal Year 7 to Year 12 students agreed with the statement that ‘some teachers have shown a special interest in my culture or ethnic background’.5
Specifically in regard to bullying, according to results from the 2019 Speaking Out Survey, 32.4 per cent of Year 7 to Year 12 students who had ever been bullied or cyber bullied reported having been teased about cultural background, the colour of their skin or their religion in the last three months.6
Further, one-half (52.4%) of Year 4 to Year 12 Aboriginal students and one-third (33.1%) of Year 4 to Year 12 non-Aboriginal students who had ever been bullied or cyber bullied reported having been teased about cultural background, the colour of their skin or their religion in the last three months.7,8
However, neither of these two data sets represents a sufficiently robust and comprehensive measure of cultural safety and the Commissioner for Children and Young People WA will continue to advocate for the development of reporting frameworks and collection of data that measures cultural safety in schools more effectively.
For more information, refer to the Commissioner’s Engaging with Aboriginal Children and Young People Toolkit.
Endnotes
- Williams R 2008, Cultural safety; what does it mean for our work practice? Australian and New Zealand Journal of Public Health, Vol 23, No 2.
- Bin-Sallik M 2003, Cultural Safety: Let's Name It!, The Australian Journal of Indigenous Education, Vol 32.
- Priest N et al 2020, Experiences of racial discrimination and cardiometabolic risk among Australian children, Brain, Behaviour and Immunity, Feb 2020.
- Cave L et al 2019, Racial discrimination and the health and wellbeing of Aboriginal and Torres Strait Islander children: Does the timing of first exposure matter?, SSM Population Health, Vol 9.
- Commissioner for Children and Young People 2018, School and Learning Consultation: Technical Report, Commissioner for Children and Young People WA, p 224.
- Commissioner for Children and young People WA 2020, Speaking Out Survey 2019 Data Tables, Commissioner for Children and young People WA [unpublished].
- Ibid.
- In the 2019 Speaking Out Survey, 41.7 per cent of Aboriginal Year 7 to 12 students reported having ever been bullied or cyber bullied and an additional 8.1 per cent said ’they don’t know’ if they had.
Last updated June 2020
At 30 June 2019, there were 2,420 WA young people in care aged between 10 and 17 years, more than one-half of whom (53.3%) were Aboriginal.1
Limited data exists on whether WA young people in care like school or feel like they belong, or whether they have supportive relationships at school. There is also limited data on how safe WA young people in care feel at school.
The WA Department of Communities collects data from children and young people in out-of-home care in WA through Viewpoint an interactive software program for children aged between five and 17 years which seeks their views on their care experiences, needs and worries.2 Data from the Viewpoint survey is not published other than one effectiveness indicator in the annual report regarding the children and young people’s experiences of safety in their care arrangement.3
In 2017, CREATE Foundation asked 1,275 Australian children and young people aged 10 to 17 years about their lives in the care system. CREATE Foundation noted in their report that the recruitment of participants proved difficult and that it resulted in a non-random sample with the possibility of bias.4 Participating students were asked to rate their educational experience using a scale from 0 to 100 where 0 is very poor and 100 is very good. The mean rating of 72.7 suggests that ‘perceptions were reasonably positive’, however, that there was room for improvement.5
In their 2013 survey, CREATE Foundation reported that a significant proportion of participating children and young people had attended four or more schools during their primary school years. Students living in residential care (as opposed to kinship or foster care) were most likely to have attended multiple schools.6 Research into the effects of student transience has shown that frequent school moves can have significant negative impacts on student engagement, sense of belonging and ability to build supportive relationships at school.7,8
In the 2017 survey, CREATE Foundation found that one-quarter of students living in out-of-home care reported experiences of bullying at school. Most cases of bullying occurred at school (25.0% of participants said they were bullied ‘reasonably often’ at school), while 8.6 per cent were bullied ‘reasonably often’ in their placement and 6.1 per cent reported being bullied ‘reasonably often’ online.9 Children and young people living in residential care and independently were more likely to experience bullying at school, in their placement and online.10
There is no information available on how WA young people in care experience their relationships with teachers and peers at school.
Young people in care are a highly vulnerable group and it is critical that they feel safe and supported at school.
Endnotes
- Department of Communities 2019, Annual Report: 2018–19, WA Government p. 26.
- The Department for Child Protection and Family Support (Department of Communities) 2016-2017 Annual Report indicated 1,269 Viewpoint surveys were completed by children in care. It should be noted that where the same young person completes a survey more than once in the relevant period, all their responses are included in this statistic. There were a total number of 3,604 children aged five to 17 years in care, therefore the maximum possible participation rate that year was 35 per cent. The total number of children in care is 4,795 at 30 June 2017.
- The proportion of children and young people who reported via Viewpoint feeling safe in their care arrangement was 96 per cent in 2018–19. Department of Communities 2019, Annual Report: 2018–19, WA Government p. 70.
- McDowall JJ 2018, Out-of-home care in Australia: Children and young people’s views after five years of National Standards, CREATE Foundation, pp. 17-19.
- Ibid, p. 80.
- McDowell JJ 2013, Experiencing out-of-home care in Australia: The views of children and young people (CREATE Report Card 2013), CREATE Foundation, pp. 60-61.
- Rumberger R 2003, The Causes and Consequences of Student Mobility, The Journal of Negro Education, Vol 72, No 1, p. 6.
- Centre for Education Statistics and Evaluation (CESE) 2016, Mobility of students in NSW government schools, Report prepared by Lu L & Rickard K.
- McDowall JJ 2018, Out-of-home care in Australia: Children and young people’s views after five years of National Standards, CREATE Foundation, p. 83.
- Ibid, p. 84.
Last updated June 2020
The Australian Bureau of Statistics Disability, Ageing and Carers, 2018 data collection reports that approximately 30,200 WA children and young people (9.2%) aged five to 14 years have reported disability.1,2
Students with disability commonly attend either special schools that enrol only students with special needs, special classes within a mainstream school or mainstream classes within a mainstream school (where students with disability might receive additional assistance).3
In 2018, almost all Australian school children aged five to 14 years with disability attended school (95.8%). Of these, around 70.0 per cent attend mainstream schools, 20.0 per cent attend special classes within a mainstream school and 11.3 per cent attend special schools.4
For more information on the adjustments that schools implement to support access and participation in learning for students with disability refer to the School attendance indicator.
Speaking Out Survey 2019
In 2019, the Commissioner for Children and Young People (the Commissioner) conducted the Speaking Out Survey which sought the views of a broadly representative sample of Year 4 to Year 12 students in WA on factors influencing their wellbeing.5 This survey was conducted across mainstream schools in WA; special schools for students with disability were not included in the sample.
In this survey, Year 7 to Year 12 students were asked: Do you have any long-term disability (lasting 6 months or more) (e.g. sensory impaired hearing, visual impairment, in a wheelchair, learning difficulties)? In total, 315 (11.4%) participating Year 7 to Year 12 students answered yes to this question.
Due to the relatively small sample size, the following results for students who reported long-term disability are observational and not representative of the full population of students with disability in Years 7 to 12 in WA. Comparisons between participating students with and without disability are therefore observational and not statistically significant. Nevertheless, the results provide an indication of the views and experiences of young people with disability.
All students were asked: In general, how do you feel about school? Almost one-quarter of students (23.8%) with disability reported liking school a lot, another one-quarter (26.6%) reported liking school a bit and close to 30 per cent (28.0%) said school was OK. More than one-in-five (21.6%) students with disability reported not liking school at all or not much. These results are similar to those of students without disability.
|
Students with disability |
Students without disability |
|
|
Likes school a lot |
23.8 |
19.9 |
|
Likes school a bit |
26.6 |
29.2 |
|
It's OK |
28.0 |
30.4 |
|
Doesn't like school much |
12.0 |
12.8 |
|
Doesn't like school at all |
9.6 |
7.7 |
Source: Commissioner for Children and Young People, Speaking Out Survey 2019 Data Tables [unpublished]
With regards to feeling a sense of belonging at school, around one-half (53.2%) of students with disability agreed they feel like they belong to their school. One-in-four (25.7%) were unsure about this and 21.0 per cent said they don’t feel like they belong at their school.
The proportion of students not feeling like they belong or being unsure about it was higher for students with disability than for students without.
|
Young people with disability |
Young people without disability |
|
|
Yes |
53.2 |
62.0 |
|
No |
21.0 |
15.3 |
|
I'm not sure |
25.7 |
22.7 |
Source: Commissioner for Children and Young People, Speaking Out Survey 2019 Data Tables [unpublished]
As for all children and young people, positive relationships with friends and teachers at school help provide young people with disability a sense of belonging and connection.6
Two-thirds (66.9%) of students with disability said they usually get along with their classmates. Around one-quarter (26.2%) of students said they get along with their classmates sometimes and seven per cent (6.9%) said hardly ever or never. In comparison, 71.2 per cent of young people without disability said they usually get along with their classmates, 24.1 per cent said sometimes and 3.9 per cent said hardly ever or never.7
Close to 60 per cent (58.6%) of students with disability said they usually get along with their teachers. One-third (33.2%) reported getting along with their teachers sometimes and eight per cent (8.2%) said hardly ever or never. In contrast, a higher proportion (64.5%) of students without disability said they usually get along with their teachers, 29.3 per cent said sometimes and 5.7 per cent said hardly ever or never.8
This data suggests that young people with disability may have a somewhat greater likelihood of having poorer relationships with both their teachers and classmates.
Research has found that children and young people with disability are more likely to feel unsafe at school and experience bullying.9,10
In the 2019 Speaking Out Survey, almost 30 per cent (29.3%) of students with disability reported feeling safe at school all the time and 46.1 per cent said they feel safe most of the time. However, one-quarter (24.4%) of students reported feeling safe at school sometimes or less including 3.2 per cent of students who answered never.
|
Students with disability |
Students without disability |
|
|
All the time |
29.3 |
33.6 |
|
Most of the time |
46.1 |
48.3 |
|
Sometimes |
12.6 |
12.1 |
|
A little bit of the time |
8.6 |
4.0 |
|
Never |
3.2 |
1.4 |
|
Prefer not to say |
0.2 |
0.5 |
Source: Commissioner for Children and Young People, Speaking Out Survey 2019 Data Tables [unpublished]
Proportion of Year 7 to Year 12 students with disability reporting feeling safe at school all the time, most of the time, sometimes, a little bit of the time or never, per cent, WA, 2019
Source: Commissioner for Children and Young People, Speaking Out Survey 2019 Data Tables [unpublished]
In the Commissioner’s consultations, children and young people particularly identify bullying as a significant safety concern.11
In the 2019 Speaking Out Survey 52.6 per cent of students with disability reported having been bullied, cyber bullied or both bullied and cyber bullied by students from their school, while 39.6 per cent of students reported they had never been bullied.
The results for students without disability are reversed: 50.1 per cent of students without disability reported they had never been bullied and 38.3 per cent said they had been bullied and/or cyber bullied by students from their school.
|
Students with disability |
Students without disability |
|
|
No |
39.6 |
50.1 |
|
Yes, bullied |
30.5 |
22.5 |
|
Yes, cyber bullied |
1.6 |
3.1 |
|
Both bullied and cyber bullied |
20.4 |
12.7 |
|
I don't know |
2.6 |
9.0 |
|
Prefer not to say |
5.2 |
2.5 |
Source: Commissioner for Children and Young People, Speaking Out Survey 2019 Data Tables [unpublished]
A survey conducted by Children and Young People with Disability Australia (CYDA) in 2016, revealed that 52 per cent of respondents (1,396 students and/or parents) reported that the student had been subject to bullying.12 This is consistent with the findings from the Speaking Out Survey and highlights the specific vulnerability to bullying of children and young people with disability.
More research is required on the school experiences of students with disability and/or long-term health conditions.
Endnotes
- The ABS uses the following definition of disability: ‘In the context of health experience, the International Classification of Functioning, Disability and Health (ICFDH) defines disability as an umbrella term for impairments, activity limitations and participation restrictions… In this survey, a person has a disability if they report they have a limitation, restriction or impairment, which has lasted, or is likely to last, for at least six months and restricts everyday activities.’ Australian Bureau of Statistics 2016, Disability, Ageing and Carers, Australia, 2015, Glossary.
- Australian Bureau of Statistics 2020, Disability, Ageing and Carers, Australia, 2018: Western Australia, Table 1.1 Persons with disability, by age and sex, estimate, and Table 1.3 Persons with disability, by age and sex, proportion of persons.
- Australian Institute of Health and Welfare 2017, Disability in Australia: changes over time in inclusion and participation in education, Cat No DIS 69, AIHW.
- Australian Bureau of Statistics 2019, 4430.0 - Disability, Ageing and Carers, Australia: 2018, Table 7.1 and 7.3: Children aged 5-14 years with disability, living in households, Whether attends school, special school, or special classes by Sex and Severity of disability – 2018, ABS.
- Commissioner for Children and Young People WA 2020, Speaking Out Survey: The views of WA children and young people on their wellbeing - a summary report, Commissioner for Children and Young People WA.
- Robinson S and Truscott J 2014, Belonging and connection of school students with disability, Children and Young People with Disability Australia, p. 5.
- Commissioner for Children and Young People WA 2020, Speaking Out Survey 2019 Data Tables, Commissioner for Children and Young People [unpublished].
- Ibid.
- Kavanagh A et al 2018, Gender, parental education, and experiences of bullying victimization by Australian adolescents with and without a disability, Child: care, health and development, Vol 44, No 2.
- PWC 2018, The economic cost of bullying in Australian schools, funded by the Alannah and Madeline Foundation, p. 9.
- Commissioner for Children and Young People WA 2018, School and Learning Consultation: Technical Report, Commissioner for Children and Young People WA, p. 41.
- Children and Young People with Disability Australia 2016, Education Survey 2016, CDA.
Last updated June 2020
Young people who like school, have positive relationships with their peers and teachers and who feel safe at school are more likely to be engaged and motivated to participate in education to their full capacity.
Students who believe that they have positive relationships with their teachers and that their teachers are caring, empathetic, fair and help resolve personal problems, are more likely to feel a greater sense of belonging than those students who perceive a negative relationship with their teachers.1 Positive relationships within school also promote resilience which enables young people to cope and thrive in the face of negative events, challenges or adversity.2
School activities and programs that facilitate a sense of belonging and improve peer and teacher relationships include peer mentoring, music, sports, science and academic extension programs, school councils and extracurricular activities. In the School and Learning Consultation, parents noted that involvement in these programs increased the number of peers students socialised with, thereby increasing their friendship group and support network, supporting learning and making students feel valued – all of which contributed to a sense of connection to the school.3
Of critical concern is that the majority (67.7%) of Year 7 to Year 12 WA students do not feel safe at school all the time. Evidence shows there is a strong interrelationship between learning and safety and that students who do not feel safe at school cannot learn to their full potential because they are distracted by feelings of stress or anxiety.4
One reason children do not feel safe at school is bullying, either physical experiences of bullying or online experiences (cyber bullying). Despite strong policy interventions and much research and investment into safety and bullying, safety at school is still a key issue for students.
There are several online resources that help school communities to create safer learning environments including the Bullying. No Way! website managed by the Safe and Supportive School Communities Working Group and the National Centre Against Bullying, the Office of the eSafety Commissioner and the Friendly Schools Plus websites. The Commissioner for Children and Young People WA also publishes the National Principles for Child Safe Organisations WA: Guidelines and other child safe resources to assist organisations, including schools, to become more child safe.
School governing bodies should review and monitor resources and programs to continuously improve policy and practice in this area. This should include monitoring of outcomes to determine whether existing programs are having an impact.
For more information on safety in schools refer to the Commissioner’s policy brief Children and young people speak out about education and safety in schools.
Schools that are safe and welcoming for all students also ensure students feel recognised, respected and supported in their culture. Recent studies have reported links between childhood experiences of racial discrimination and health risks over the longer term.5,6 The Speaking Out Survey 2019 found that one-half (52.4%) of Year 4 to Year 12 Aboriginal students who had ever been bullied or cyber bullied had been teased about their cultural background, the colour of their skin or their religion in the last three months.
The Department of Education’s Aboriginal Cultural Standards Framework is a useful tool for developing proficiency in Aboriginal culture, as it provides a continuum to measure cultural understanding and inclusive practice.
Data gaps
Research has highlighted that children and young people with disability are more likely to experience bullying and feel unsafe at school,7,8 and yet there is no periodic data collection or survey measuring how WA children and young people with disability and/or long-term health conditions feel about school.
There is also limited data on whether WA young people in care feel a sense of belonging and support at school and no information on whether they feel safe at school. Young people in care are a highly vulnerable group and it is critical that they feel safe and supported at school.
Endnotes
-
Allen K et al 2016, What schools need to know about fostering school belonging: a meta-analysis, Educational Psychology Review, pp. 1-34.
-
Cahill H et al 2014, Building Resilience in Children and Young People, A Literature Review for the Department of Education and Early Childhood Development (DEECD), Youth Research Centre, Melbourne Graduate School of Education, University of Melbourne, p. 5
-
Commissioner for Children and Young People 2018, School and Learning Consultation: Technical Report, Commissioner for Children and Young People WA, p. 234.
-
Compare Blakemore SJ and Frith U 2005, The learning brain: Lessons for education, Blackwell Publishing.
-
Priest N et al 2020, Experiences of racial discrimination and cardiometabolic risk among Australian children, Brain, Behaviour and Immunity, Feb 2020.
-
Cave L et al 2019, Racial discrimination and the health and wellbeing of Aboriginal and Torres Strait Islander children: Does the timing of first exposure matter?, SSM Population Health, Vol 9.
-
Pinquart M 2017, Systematic Review: Bullying Involvement of Children With and Without Chronic Physical Illness and/or Physical/Sensory Disability—a Meta-Analytic Comparison With Healthy/Nondisabled Peers, Journal of Pediatric Psychology, Vol 42, No 3.
-
PWC 2018, The economic cost of bullying in Australian schools, funded by the Alannah and Madeline Foundation, p. 9.
For more information on children and young peoples’ views about school, sense of belonging, supportive relationships and bullying and the resulting impact on attendance, engagement and educational outcomes refer to the following resources:
- Allen K et al 2016, What schools need to know about fostering school belonging: a meta-analysis, Educational Psychology Review, Vol 30, No 1.
- Cahill H et al 2014, Building Resilience in Children and Young People, A Literature Review for the Department of Education and Early Childhood Development (DEECD), Youth Research Centre, Melbourne Graduate School of Education, University of Melbourne.
- Cross D et al 2009, Australian Covert Bullying Prevalence Study (ACBPS), Child Health Promotion Research Centre, Edith Cowan University.
- Due C et al 2016, Experiences of school belonging for young children of refugee backgrounds, The Educational and Developmental Psychologist, Vol 33.
- Hancock KJ and Zubrick SR 2015, Children and young people at risk of disengagement from school, report for Commissioner for Children and Young People, Telethon Kids Institute, University of Western Australia.
- PWC 2018, The economic cost of bullying in Australian schools, National Centre Against Bullying: Alannah and Madeline Foundation.
For more information on young people’s views, see Speaking out about School and Learning.