


Positive antenatal environment

Health influences begin even before birth, with a mother’s own health and wellbeing playing an important role in the baby’s development in utero. A healthy start to life contributes to good health and wellbeing for a child over their lifetime.
This indicator considers three key influences on a baby’s development during pregnancy - a mother’s attendance at antenatal visits, maternal tobacco smoking and alcohol consumption during pregnancy. While these activities have a significant impact on a baby’s health, other factors are also influential including a mothers’ diet, parental stress, poverty and other socioeconomic and environmental factors.
Last updated February 2022
Data is available on whether WA children are provided with a positive antenatal environment.
Overview
Early and regular attendance at antenatal services to monitor and enhance the health of mother and baby during pregnancy provides important support to parents and helps babies receive the best possible start to life. These services should also provide a supportive environment where mothers can be encouraged to discuss any lifestyle concerns and consider making changes.
There has been a sustained increase in the reported number of WA mothers attending their first antenatal visit in under 14 weeks (50.9% in 2011 compared to 62.9% in 2020).
There has been a steady increase in the proportion of WA women not smoking during their pregnancy since 2006 (82.5% in 2006 compared to 92.1% in 2019).
Proportion of women who did not smoke during pregnancy, per cent, WA and Australia, 2006 to 2019
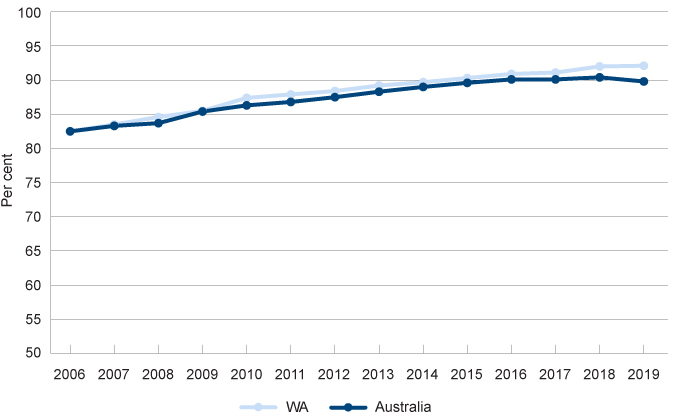
Source: Australian Institute of Health and Welfare, Data tables for Australia's mothers and babies 2019, Table 2.3: Women who gave birth, by smoking status and selected maternal characteristics, 2010–2019
There was a significant increase in the number of women who reported they drank no alcohol while pregnant in WA from 2007 to 2019 (38.4% compared to 54.7%).
Across most of WA, the proportion of Aboriginal women not drinking during pregnancy has increased since 2017.
Areas of concern
Aboriginal mothers are much less likely than non-Aboriginal mothers to have their first antenatal visit in the first trimester (for example, in the Perth South Metropolitan region 36.6% of Aboriginal mothers attended in the first trimester compared to 51.4% of non-Aboriginal mothers).
Mothers living in regional and remote areas are more likely to smoke during pregnancy than mothers living in the metropolitan area (17.9% in regional and remote WA compared to 6.1% in the Perth North Metropolitan region and 9.2% in the Perth South Metropolitan region).
Other measures
Low birth weight is often considered a key measure of child wellbeing. Low birth weight has not been selected as a measure in the Indicators of wellbeing. This is not because it is not important, but because low birth weight is often the result of other antenatal factors such as smoking during pregnancy, maternal age and poor maternal health and wellbeing, which are being reported in the Indicators.
For information on low birth weight rates in WA refer to the AIHW Children’s Headline Indicators website which provides regular data on this measure by jurisdiction and other disaggregations.
Infant mortality rates are also often used as a population level measure of child wellbeing. It informs understandings of the factors that influence a child’s life and death chances at birth and provides insight into the effectiveness of the health system in antenatal and perinatal health.1 Infant mortality rates have not been included as a measure in the Indicators of wellbeing as the data is reported regularly in other sources. Furthermore, infant mortality rates are influenced by the measures being reported, such as smoking during pregnancy or lack of antenatal care.
For information on infant mortality rates in WA refer to the Mothers and Babies: Infant mortality rates website, which is regularly updated, or for more comparative data across Australia refer to the AIHW Children’s Headline Indicators website.
Endnotes
- Australian Institute of Health and Welfare (AIHW) 2018, Children’s Headline Indicators – Infant Mortality, AIHW.
Last updated February 2022
Antenatal visits between a pregnant woman and a midwife or doctor assess and monitor the health and wellbeing of the mother and baby throughout pregnancy. Antenatal visits provide an opportunity for regular clinical assessments, screening for a range of infections and abnormalities, and advice on healthy lifestyles.1
There is substantial evidence that regular antenatal care, particularly in the first trimester (less than 14 weeks’ gestational age) is associated with better maternal health in pregnancy and positive child health outcomes.2
Australian Pregnancy Care Guidelines recommend that the first antenatal visit occur within the first 10 weeks of pregnancy and that first-time mothers with an uncomplicated pregnancy attend 10 visits (seven visits for subsequent uncomplicated pregnancies).3
The National Perinatal Data Collection (NPDC) is a national collection of data on pregnancy and childbirth managed by the Australian Institute of Health and Welfare (AIHW).4
The data for WA may not be complete as data is generally only collected for women who attend their first antenatal visit at their birth hospital.
A lower proportion of WA mothers are reported as attending their first antenatal visit in the first trimester than Australian mothers overall (63.1% compared to 75.9%).
|
WA |
Australia |
|||
|
No. of weeks |
Number |
Per cent |
Number |
Per cent |
|
Less than 14 |
20,747 |
63.1 |
226,690 |
75.9 |
|
14 to 19 |
3,757 |
11.4 |
43,310 |
14.5 |
|
20 and over |
7,220 |
22.0 |
25,435 |
8.5 |
|
Not applicable |
64 |
0.2 |
347 |
0.1 |
|
Not stated |
1,080 |
3.3 |
2,785 |
0.9 |
|
Total |
32,868 |
100.0 |
298,567 |
100.0 |
Source: AIHW, Data tables: National Perinatal Data Collection annual update 2019, Table 2.13 Duration of pregnancy at first antenatal visit by selected characteristics for women who gave birth in 2019
Note: For WA, gestational age at first visit is reported by birth hospital; therefore, data may not be available for women who attend their first antenatal visit outside the birth hospital. This particularly affects hospitals without antenatal care services onsite.
There is substantial variation across Australia in the proportion of mothers recorded as attending their first antenatal visit in the first 13 weeks.
|
Proportion of mothers |
|
|
NSW |
79.6 |
|
VIC |
73.7 |
|
QLD |
79.3 |
|
WA |
63.1 |
|
SA |
81.7 |
|
TAS |
86.4 |
|
ACT |
51.2 |
|
NT |
85.2 |
|
Australia |
75.9 |
Source: AIHW, Data tables: National Perinatal Data Collection annual update 2019, Table 2.13 Duration of pregnancy at first antenatal visit by selected characteristics for women who gave birth in 2019
Notes:
1. For WA, gestational age at first visit is reported by birth hospital; therefore, data may not be available for women who attend their first antenatal visit outside the birth hospital. This particularly affects hospitals without antenatal care services onsite.
2. For ACT, first antenatal visit is often the first hospital antenatal clinic visit. In many cases, earlier antenatal care provided by the woman's general practitioner is not reported.
3. Proportion has been calculated by the Commissioner for Children and Young People including the visits that were reported as duration ‘Not stated’. WA has a high proportion of visits that were not categorised compared to other jurisdictions.
Data from the WA Department of Health shows that there has been an increase in the reported number of WA mothers attending their first antenatal visit in less than 14 weeks since 2011 (50.9% in 2011 compared to 63.0% in 2020).
|
<14 |
14 to 27 |
≥28 |
Not reported |
|
|
2011 |
50.9 |
30.5 |
6.6 |
11.9 |
|
2012 |
58.5 |
28.6 |
4.8 |
8.1 |
|
2013 |
62.1 |
26.6 |
4.7 |
6.6 |
|
2014 |
61.4 |
27.8 |
4.3 |
6.5 |
|
2015 |
64.9 |
25.5 |
4.5 |
5.1 |
|
2016 |
61.8 |
27.4 |
4.0 |
6.9 |
|
2017 |
62.9 |
27.8 |
3.6 |
5.7 |
|
2018 |
63.0 |
28.1 |
4.1 |
4.9 |
|
2019 |
63.4 |
29.5 |
3.9 |
3.2 |
|
2020 |
62.9 |
30.5 |
3.6 |
3.0 |
Source: WA Department of Health, Western Australian Mothers and Babies Summary Information
Note: Data for most recent complete calendar year are incomplete and subject to change.
Duration of pregnancy at first antenatal visit in weeks, per cent of mothers, WA, 2011 to 2020
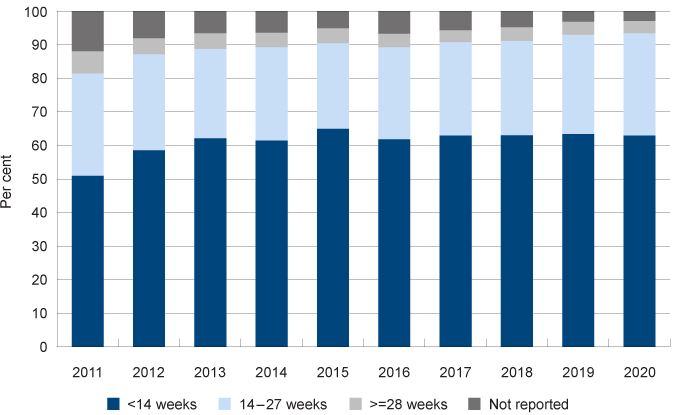
Source: WA Department of Health, Western Australian Mothers and Babies Summary Information
The increase in mothers attending over the past decade is in part due to improvements in the data collection process resulting in a reduction in the ‘not reported’ category (the equivalent of ‘not stated’ in the AIHW report). This category has been further reduced since 2018 from 4.9 per cent to 3.0 per cent in 2020.
Mothers who are less likely to attend antenatal care in the first trimester include women living in lower socioeconomic status areas, those living in very remote areas, Aboriginal mothers and women born in non-English speaking countries.5
There is considerable variation in women’s use of antenatal services across WA.
|
<14 weeks |
14 to 19 |
≥20 |
|
|
North Metropolitan |
60.3 |
9.7 |
30.0 |
|
South Metropolitan |
53.9 |
18.8 |
27.3 |
|
East Metropolitan |
66.2 |
9.8 |
24.1 |
|
Kimberley |
63.1 |
17.0 |
19.9 |
|
Pilbara |
58.2 |
6.8 |
35.0 |
|
Mid West |
79.4 |
9.0 |
11.6 |
|
Wheatbelt |
58.5 |
11.6 |
29.9 |
|
Goldfields |
84.3 |
5.8 |
9.9 |
|
Great Southern |
82.2 |
7.0 |
10.8 |
|
South West |
82.0 |
3.9 |
14.2 |
Source: Custom report provided to the Commissioner for Children and Young People WA by the WA Department of Health from the Midwives Notification System and Birth Notification Dataset [unpublished]
Note: Data for most recent complete calendar year are incomplete and subject to change.
Duration of pregnancy at first antenatal visit in weeks by region, per cent of mothers, WA, 2019
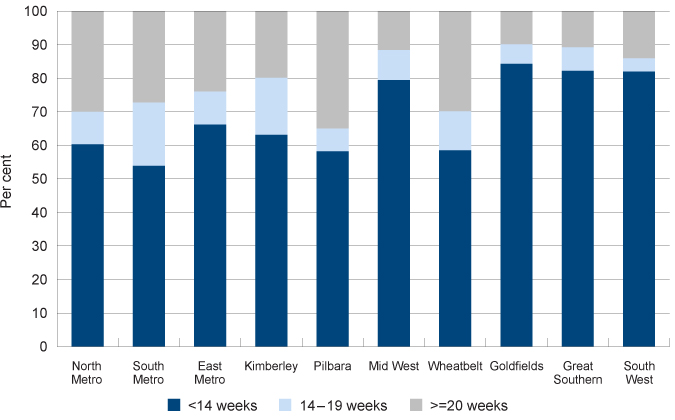
Source: Custom report provided to the Commissioner for Children and Young People WA by the WA Department of Health from the Midwives Notification System and Birth Notification Dataset [unpublished]
In 2019, the South Metropolitan area had the lowest proportion of women attending an antenatal visit in the first trimester (53.9%), followed by the Pilbara (58.2%) and the Wheatbelt (58.5%). The Goldfields (84.3%), Great Southern (82.2%) and the South West (82.0%) had the highest proportion of women attending their first antenatal visit in the first trimester.
Aboriginal mothers, on average, access services later in their pregnancy and have fewer visits than non-Aboriginal mothers.6
|
WA |
Australia |
|||
|
Aboriginal |
Non-Aboriginal |
Aboriginal |
Non-Aboriginal |
|
|
Less than 14 weeks |
56.4 |
65.3 |
63.0 |
70.8 |
|
14 to 19 weeks |
13.6 |
13.2 |
17.4 |
18.1 |
|
20 or more weeks |
28.6 |
21.4 |
18.7 |
11.0 |
|
No antenatal care |
1.4 |
n.p. |
0.9 |
0.1 |
Source: AIHW, Aboriginal and Torres Strait Islander Health Performance Framework 2020, Table D3.01.10
n.p. Not published because of small numbers, confidentiality or other concerns about the quality of the data.
Note: For WA, gestational age at first visit is reported by birth hospital; therefore, data may not be available for women who attend their first antenatal visit outside the birth hospital. This particularly affects hospitals without antenatal care services onsite.
The quality and accessibility of primary health care available to pregnant women and infants is directly correlated with the infant mortality rate.7 Specifically for Aboriginal mothers, Aboriginal stillbirth rates in WA are higher than rates for all WA infants (10.8 per 1,000 and 7.2 per 1,000, respectively in 2014–2018).8
There are large differences in attendance across regions in WA. Aboriginal and non-Aboriginal women living in the South Metropolitan region are less likely to attend their first antenatal visit within the first 12 weeks than women in other regions.
Aboriginal women across most regional and remote areas are more likely to attend their first antenatal visit during weeks one to 12 than those in the metropolitan area.
|
Aboriginal mothers |
Non-Aboriginal mothers |
|
|
North Metropolitan |
46.6 |
59.3 |
|
South Metropolitan |
36.6 |
51.4 |
|
East Metropolitan |
38.1 |
65.2 |
|
Kimberley |
59.6 |
65.1 |
|
Pilbara |
54.3 |
57.6 |
|
Midwest |
61.1 |
80.4 |
|
Wheatbelt |
41.3 |
58.8 |
|
Goldfields |
60.2 |
86.2 |
|
Great Southern |
63.9 |
79.9 |
|
South West |
84.0 |
81.1 |
Source: Custom report provided to Commissioner for Children and Young People WA from the Department of Health, Midwives Notification System and Birth Notification Dataset [unpublished]
Note: The majority of public homebirths are included in the Birth Notification database, but homebirths attended by private practising midwives are not. The 2019 data may be incomplete and subject to change.
Proportion of mothers attending first antenatal visit in 1 to 12 weeks gestational age by region and Aboriginal status of mothers, per cent, WA, 2019
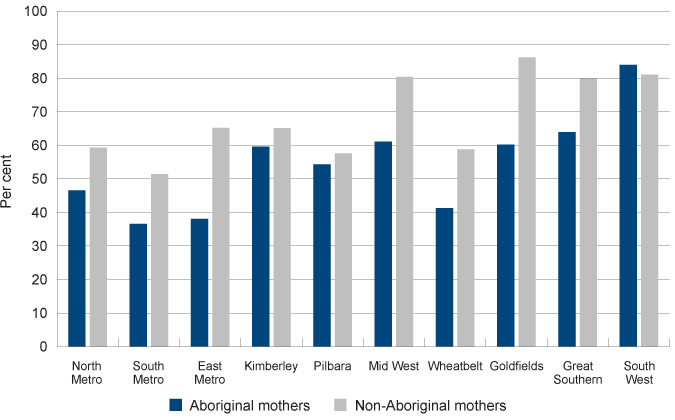
Source: Custom report provided to Commissioner for Children and Young People WA from the Department of Health, Midwives Notification System and Birth Notification Dataset [unpublished]
WA Aboriginal mothers have increased attendance at antenatal visits in the first 12 weeks since 2014 across all regional and remote areas, except the Kimberley which has remained relatively stable. In the metropolitan area, attendance has increased in the North Metropolitan region and decreased in the South and East Metropolitan regions.
|
2014 |
2015 |
2016 |
2017 |
2018 |
2019 |
|
|
North Metropolitan |
32.0 |
38.4 |
29.5 |
30.5 |
35.7 |
46.6 |
|
South Metropolitan |
38.6 |
45.5 |
37.3 |
45.1 |
41.9 |
36.6 |
|
East Metropolitan |
43.9 |
43.0 |
44.5 |
41.8 |
43.7 |
38.1 |
|
Kimberley |
60.0 |
68.8 |
61.0 |
62.5 |
64.1 |
59.6 |
|
Pilbara |
26.7 |
50.8 |
49.0 |
54.5 |
55.3 |
54.3 |
|
Mid West |
54.5 |
55.6 |
61.9 |
56.2 |
54.5 |
61.1 |
|
Wheatbelt |
38.5 |
36.8 |
46.6 |
40.0 |
51.5 |
41.3 |
|
Goldfields |
28.8 |
34.1 |
44.7 |
51.2 |
47.1 |
60.2 |
|
Great Southern |
48.8 |
59.5 |
65.9 |
57.8 |
65.8 |
63.9 |
|
South West |
64.3 |
64.5 |
75.0 |
77.5 |
77.6 |
84.0 |
Source: Custom report provided to Commissioner for Children and Young People WA from the Department of Health, Midwives Notification System and Birth Notification Dataset [unpublished]
Attendance of non-Aboriginal mothers at antenatal visits in the first 12 weeks is similarly varied across the state over the past five years. Attendance has decreased substantially for non-Aboriginal women in the Kimberley (2014: 79.3%, 2019: 65.1%) and the South Metropolitan region (2014: 58.4%, 2019: 51.4%). Conversely, attendance has increased substantially in the Pilbara (2014: 35.7%, 2019: 57.6%), the Mid West (2014: 66.0%, 2019: 80.4%), the Goldfields (2014: 58.9%, 2019: 86.2%) and the South West (2014: 70.7%, 2019: 81.1%).
|
2014 |
2015 |
2016 |
2017 |
2018 |
2019 |
|
|
North Metropolitan |
57.9 |
59.3 |
55.2 |
54.5 |
56.7 |
59.3 |
|
South Metropolitan |
58.4 |
61.0 |
55.7 |
57.6 |
52.9 |
51.4 |
|
East Metropolitan |
61.1 |
66.0 |
62.5 |
62.5 |
63.3 |
65.2 |
|
Kimberley |
79.3 |
86.3 |
87.2 |
89.6 |
84.6 |
65.1 |
|
Pilbara |
35.7 |
58.7 |
62.8 |
72.3 |
76.5 |
57.6 |
|
Mid West |
66.0 |
69.5 |
73.4 |
74.4 |
80.5 |
80.4 |
|
Wheatbelt |
56.5 |
54.7 |
53.0 |
55.2 |
60.4 |
58.8 |
|
Goldfields |
58.9 |
66.1 |
69.5 |
76.9 |
82.6 |
86.2 |
|
Great Southern |
78.7 |
84.6 |
84.9 |
82.6 |
82.3 |
79.9 |
|
South West |
70.7 |
72.0 |
72.4 |
78.4 |
80.0 |
81.1 |
Source: Custom report provided to Commissioner for Children and Young People WA from the Department of Health, Midwives Notification System and Birth Notification Dataset [unpublished]
Note: The majority of public homebirths are included in the Birth Notification database, but homebirths attended by private practising midwives are not. The 2019 data may be incomplete and subject to change.
Endnotes
-
Australian Institute of Health and Welfare 2018, Australia’s mothers and babies 2016 - in brief, Perinatal statistics series no 34, Cat No Per 97, AIHW.
-
Molloy C et al 2018, Restacking the Odds: Antenatal care: An evidence-based review of the relevant measures to assess quality, quantity and participation, Melbourne Children’s Research Institute, p. 5.
-
Department of Health, Clinical Practice Guidelines – Pregnancy Care: 2018 Edition, Australian Government, p. 10.
-
Australian Institute of Health and Welfare 2018, National Perinatal Data Collection, 2016: Quality Statement [website].
-
Australian Institute of Health and Welfare 2018, Australia’s mothers and babies 2016 - in brief, Perinatal statistics series no 34, Cat No Per 97, AIHW, p 7.
-
Australian Institute of Health and Welfare 2020, Aboriginal and Torres Strait Islander Health Performance Framework 2020 – Data visualisations Antenatal care, AIHW [online].
-
Australian Research Alliance for Children and Youth (ARACY) 2008, Technical Report: The Wellbeing of Young Australians, ARACY, p. 49.
-
Australian Institute of Health and Welfare 2020, Aboriginal and Torres Strait Islander Health Performance Framework 2020 – Data visualisations Perinatal mortality, Figure 1.21.4: Perinatal mortality rates, by Indigenous status and jurisdiction, NSW, Qld, WA, SA and NT, 2014–2018.
Last updated February 2022
Smoking during pregnancy is one of the leading preventable causes of a wide range of adverse outcomes for babies. There is strong evidence that smoking in pregnancy is associated with low birth weight and increased risk of a child being born prematurely. There is also evidence of association with sudden infant death syndrome (SIDS).1
The effects of maternal smoking during pregnancy can also persist throughout a child’s life. These effects include increased likelihood of asthma, lower cognitive function and behavioural issues.2
There has been a steady increase in the number of women not smoking during their pregnancy in WA and across Australia over the last 10 years.
|
WA |
Australia |
|
|
2006 |
82.5 |
82.5 |
|
2007 |
83.5 |
83.3 |
|
2008 |
84.6 |
83.7 |
|
2009 |
85.5 |
85.4 |
|
2010 |
87.4 |
86.3 |
|
2011 |
87.9 |
86.8 |
|
2012 |
88.4 |
87.5 |
|
2013 |
89.2 |
88.3 |
|
2014 |
89.7 |
89.0 |
|
2015 |
90.3 |
89.6 |
|
2016 |
90.9 |
90.1 |
|
2017 |
91.1 |
90.1 |
|
2018 |
92.0 |
90.4 |
|
2019 |
92.1 |
89.8 |
Source: Australian Institute of Health and Welfare, Data tables for Australia's mothers and babies 2019, Table 2.3: Women who gave birth, by smoking status and selected maternal characteristics, 2010-2019
Notes:
1. Data from 2006 to 2010 sourced from previous years’ Australia’s Mothers and babies reports.
2. Mother's tobacco smoking status during pregnancy is self-reported.
3. For WA, ‘Smoked’ includes occasional smoking. ‘Did not smoke’ includes ‘Not determined’ average number of tobacco cigarettes smoked per day in first 20 weeks of pregnancy and after 20 weeks of pregnancy. For WA, smoking status was determined at multiple locations and times and is therefore difficult to report accurately at time of birth.
Proportion of women who did not smoke during pregnancy, per cent, WA and Australia, 2006 to 2019
Source: Australian Institute of Health and Welfare, Data tables for Australia's mothers and babies 2019, Table 2.3: Women who gave birth, by smoking status and selected maternal characteristics, 2010-2019
Teenage mothers are much more likely to smoke during pregnancy than older mothers. In 2015, 30.9 per cent of WA mothers under 20 years of age reported smoking during pregnancy. This aligns with research which shows the young women who are socio-economically disadvantaged and engaging in other risky health behaviours such as smoking are at greater risk of pregnancy.3
|
Per cent |
|
|
19 years and under |
30.9 |
|
20 to 24 years |
21.9 |
|
25 to 29 years |
10.3 |
|
30 to 34 years |
6.2 |
|
35 to 39 years |
6.6 |
|
40 years and over |
7.4 |
|
Total |
9.7 |
Source: WA Department of Health, Western Australia’s Mothers and Babies, 2015: 33rd Annual Report of the Western Australian Midwives’ Notification System
Significantly more women who live in regional or remote WA smoke during pregnancy. However, since 2012 there has been a steady decrease in the proportion of women smoking in the first 20 weeks of pregnancy across WA.
Significantly more women who live in regional or remote WA smoke during pregnancy. However, since 2012 there has been a steady decrease in the proportion of women smoking in the first 20 weeks of pregnancy across WA.
|
Perth North |
Perth South |
Country WA |
Australia |
|
|
2012 |
7.5 |
11.5 |
18.9 |
12.1 |
|
2013 |
6.5 |
9.8 |
18.9 |
11.3 |
|
2014 |
6.3 |
9.5 |
18.3 |
10.6 |
|
2015 |
6.1 |
9.2 |
17.4 |
10.1 |
|
2016 |
5.7 |
8.3 |
17.1 |
9.5 |
|
2017 |
5.5 |
8.0 |
16.5 |
9.5 |
|
2018 |
5.0 |
7.4 |
15.3 |
9.2 |
|
2019 |
4.8 |
7.0 |
15.6 |
9.0 |
Source: AIHW, National Core Maternity Indicators - National Perinatal Data Collection
In 2019, 35.2 per cent of Australian mothers living in very remote locations smoked in the first 20 weeks of pregnancy, compared to 6.8 per cent of mothers in major cities. In the same year, almost one fifth (17.7%) of Australian mothers living in the lowest socioeconomic areas smoked in the first 20 weeks of pregnancy, compared to 2.8 per cent in the highest socioeconomic areas.4
Aboriginal women are more likely to smoke during pregnancy than non-Aboriginal women across all regions of WA.
|
Aboriginal |
Non-Aboriginal |
|
|
North Metropolitan |
60.2 |
96.5 |
|
South Metropolitan |
64.3 |
94.0 |
|
East Metropolitan |
62.6 |
94.3 |
|
Kimberley |
45.5 |
92.3 |
|
Pilbara |
55.3 |
93.5 |
|
Mid West |
57.9 |
88.0 |
|
Wheatbelt |
58.7 |
89.2 |
|
Goldfields |
50.8 |
87.7 |
|
Great Southern |
61.1 |
89.4 |
|
South West |
69.1 |
90.9 |
|
Total |
57.3 |
94.1 |
Source: Custom report provided to the Commissioner for Children and Young People WA by WA Department of Health from the Midwives Notification System and Birth Notification Dataset [unpublished]
Aboriginal women in the Kimberley had the lowest rate of not smoking during pregnancy (45.5%) and Aboriginal women in the South West had the highest rate of not smoking during pregnancy (69.1%). In contrast, non-Aboriginal women in the Goldfields had the lowest rate of not smoking (87.7%), while non-Aboriginal women in North Metropolitan Perth had the highest rate of not smoking during pregnancy (96.5%).
While many Aboriginal mothers have healthy pregnancies, poor health and social disadvantage contribute to a higher proportion of Aboriginal mothers and their babies experiencing adverse outcomes.
Aboriginal mothers are six times more likely to be teenagers,5 14 times more likely to live in remote and very remote areas and 2.4 times as likely to live in disadvantaged areas, than non-Aboriginal mothers.6 Each of these characteristics increase the likelihood of a mother smoking during pregnancy.
There are also social factors that increase the likelihood of Aboriginal mothers smoking during pregnancy including the normalisation of smoking in many Aboriginal communities and high level of stressors including domestic violence and deaths in the family.7
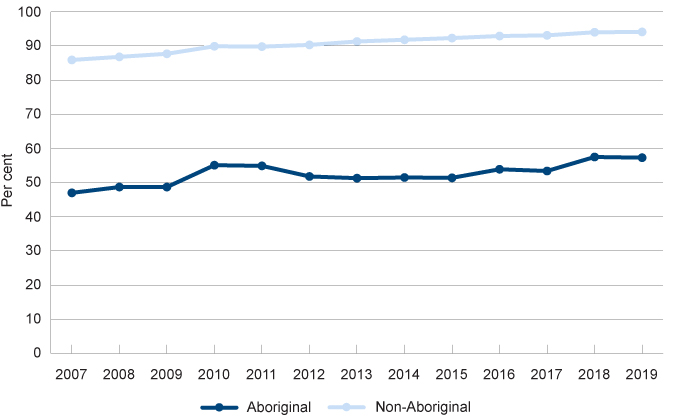
There has however been a steady increase in the proportion of Aboriginal women (and non-Aboriginal women) not smoking during pregnancy since 2007.
|
Aboriginal |
Non-Aboriginal |
|
|
2007 |
47.0 |
85.9 |
|
2008 |
48.7 |
86.8 |
|
2009 |
48.7 |
87.7 |
|
2010 |
55.1 |
89.9 |
|
2011 |
54.9 |
89.8 |
|
2012 |
51.8 |
90.3 |
|
2013 |
51.3 |
91.3 |
|
2014 |
51.5 |
91.8 |
|
2015 |
51.4 |
92.3 |
|
2016 |
53.9 |
92.9 |
|
2017 |
53.4 |
93.1 |
|
2018 |
57.5 |
94.0 |
|
2019 |
57.3 |
94.1 |
Source: Custom report provided to the Commissioner for Children and Young People WA by WA Department of Health from the Midwives Notification System and Birth Notification Dataset [unpublished]
Rate of not smoking tobacco during pregnancy by Aboriginal status, per cent, WA, 2007 to 2019
Source: Custom report provided to the Commissioner for Children and Young People WA by WA Department of Health from the Midwives Notification System and Birth Notification Dataset [unpublished]
In the metropolitan area, the proportion of Aboriginal mothers not smoking during pregnancy has increased from 2014 to 2019. Similarly, in the Kimberley, Pilbara, Mid West and South West, the proportion of Aboriginal mothers not smoking has increased since 2014. In the Wheatbelt and the Goldfields the proportion of Aboriginal mothers not smoking during pregnancy has decreased marginally over that timeframe.
|
2014 |
2015 |
2016 |
2017 |
2018 |
2019 |
|
|
North Metropolitan |
54.4 |
53.5 |
54.3 |
53.4 |
57.1 |
60.2 |
|
South Metropolitan |
59.3 |
56.1 |
63.2 |
62.6 |
61.9 |
64.3 |
|
East Metropolitan |
55.5 |
51.5 |
57.5 |
58.8 |
62.4 |
62.6 |
|
Kimberley |
40.0 |
42.2 |
41.7 |
45.9 |
46.6 |
45.5 |
|
Pilbara |
49.5 |
61.4 |
58.1 |
57.3 |
59.1 |
55.3 |
|
Mid West |
47.1 |
52.8 |
54.5 |
44.3 |
59.1 |
57.9 |
|
Wheatbelt |
62.6 |
53.7 |
51.1 |
48.0 |
59.1 |
58.7 |
|
Goldfields |
52.9 |
48.9 |
56.7 |
50.4 |
51.4 |
50.8 |
|
Great Southern |
61.0 |
62.2 |
52.3 |
62.2 |
68.4 |
61.1 |
|
South West |
60.7 |
48.4 |
60.7 |
61.3 |
64.7 |
69.1 |
|
Total |
51.5 |
51.4 |
53.9 |
53.4 |
57.5 |
57.3 |
Source: Custom report provided to the Commissioner for Children and Young People WA by WA Department of Health from the Midwives Notification System and Birth Notification Dataset [unpublished]
Endnotes
- Mendelsohn C et al 2014, Management of smoking in pregnant women, Australian Family Physician, Vol 43, No 1–2.
- Ibid, p. 47.
- Australian Institute of Health and Welfare (AIHW) 2015, Teenage mothers in Australia in 2015, AIHW.
- Australian Institute of Health and Welfare 2021, Australia’s mothers and babies 2019 – web report, Perinatal statistics series no 34, Cat No Per 101, AIHW.
- Refer to the Healthy behaviours Indicator in age group 12 to 17 years.
- Australian Institute of Health and Welfare 2018, Australia’s mothers and babies 2016 - in brief, Perinatal statistics series no 34, Cat No Per 97, AIHW, p 42.
- Department of Health 2018, Clinical Practice Guidelines – Pregnancy Care: 2018 Edition, Australian Government, p. 31, 84, 87.
Last updated February 2022
Drinking alcohol is linked to a range of conditions including low birth weight, alcohol-related birth defects, alcohol-related neurodevelopmental disorders and a number of conditions that are broadly classified as Fetal Alcohol Spectrum Disorder (FASD).
Fetal Alcohol Syndrome (FAS) is a severe condition in children that can result from drinking alcohol during pregnancy, and is one of the conditions which falls under the classification of FASD. FAS is the most common preventable cause of intellectual disability in children. The prevalence of FASD (and FAS) in Australia and WA is currently unknown as children are not routinely screened.1
There is no conclusive evidence on whether there is a safe low level of drinking while pregnant.2 While it is well accepted that heavy alcohol consumption during pregnancy is a risk factor for FASD and other negative birth outcomes, the evidence of the impact of lower levels of drinking is limited.3,4 The National Health and Medical Research Council’s Australian Guidelines to Reduce Health Risks from Drinking Alcohol advise women who are pregnant or planning a pregnancy that not drinking is the safest option as maternal alcohol consumption may adversely affect the developing foetus.
There is less data on alcohol consumption during pregnancy than smoking during pregnancy. Unlike smoking during pregnancy, drinking alcohol during pregnancy is not included in the Perinatal National Minimum Data Set. Since 2010, the Australian Institute of Health and Welfare (AIHW), in partnership with the National Perinatal Data Development Committee (NPDDC), has been progressing work to develop a nationally agreed, uniform method for measuring and recording alcohol use in pregnancy. Some data on alcohol consumption during pregnancy are available for the first time in 2019 and are published in the AIHW 2021 Mothers and Babies report.5
The following data has been provided by the AIHW to the Commissioner for Children and Young People WA from the National Drug Strategy Household Survey (NDSHS).
The NDSHS is a nationally representative survey that collects self-reported information on tobacco, alcohol and illicit drug use and attitudes from persons aged 12 years and over.
The questions on drinking alcohol during pregnancy have changed over time to provide more accurate data. The following data is based on a question which asked women whether they drank: “More, less, same amount, don’t drink alcohol”. There is some uncertainty regarding how women interpret and answer this question, including whether women who did not drink during pregnancy may select ‘don’t drink alcohol’ or drank less. This data therefore likely underestimates the proportion of women who did not drink alcohol during pregnancy, however is useful for trend purposes.
|
2001 |
2004 |
2007 |
2010 |
2013 |
2016 |
2019 |
|
|
More or same |
6.6* |
4.5** |
2.8** |
1.0** |
3.6** |
n.p. |
n.p. |
|
Less |
57.3 |
63.4 |
58.8 |
48.8 |
50.6 |
33.5# |
45.3 |
|
Did not drink alcohol |
36.1 |
32.1 |
38.4 |
50.1 |
45.8 |
65.3# |
54.7 |
Source: AIHW analysis of NDSHS data – custom report provided to the Commissioner for Children and Young People WA [unpublished]
# Statistically significant change between 2013 and 2016.
* Estimate has a relative standard error between 25 per cent and 50 per cent and should be used with caution.
** Estimate has a high level of sampling error (relative standard error of 51% to 90%), meaning that it is unsuitable for most uses.
n.p. Not published because of small numbers, confidentiality or other concerns about the quality of the data.
Note: Base includes women who were pregnant including those who were pregnant and breastfeeding at the same time.
Proportion of women aged 14 to 49 years who drank no alcohol while pregnant, per cent, WA and Australia, 2001 to 2019
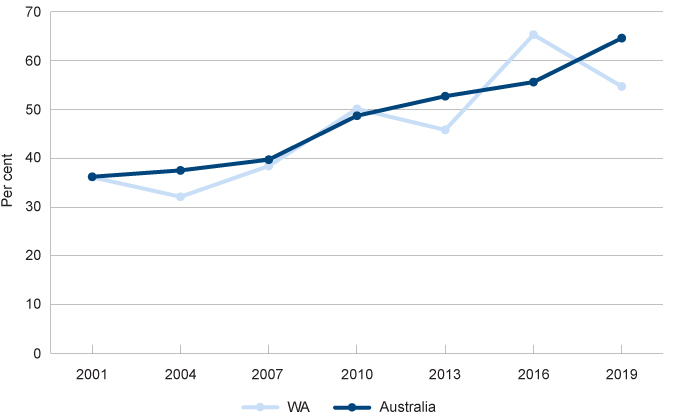
Source: AIHW analysis of NDSHS data – custom report provided to the Commissioner for Children and Young People WA [unpublished]
There was a statistically significant increase from 2013 to 2016 in the proportion of mothers in WA reporting they didn’t drink alcohol during pregnancy, however this partly reversed in 2019 and was offset by the change in the proportion of mothers reporting they drank less alcohol during pregnancy.
Another question asked in the NDSHS is: At any time in the last 12 months when you were pregnant but did not yet know, did you use alcohol?6 Just over one-half (58.6%) of WA women who were pregnant consumed alcohol before they knew they were pregnant, this reduced to approximately 15.4 per cent of women after they knew they were pregnant (subject to a high relative standard error).7
|
2013 |
2016 |
2019 |
|
|
Before they knew they were pregnant |
48.7 |
67.3 |
58.6 |
|
After they knew they were pregnant |
17.1* |
39.2 |
15.4*# |
|
All pregnant women |
46.0 |
41.2 |
36.1 |
Source: AIHW analysis of NDSHS data – custom report provided to the Commissioner for Children and Young People WA [unpublished]
* Estimate has a relative standard error of 25 per cent to 50 per cent and should be used with caution.
# Statistically significant change between 2016 and 2019.
Data from the NDSHS suggests that WA women are more likely than women from all other states and territories to drink alcohol during pregnancy.
|
Per cent |
|
|
WA |
36.1 |
|
NSW |
29.7 |
|
VIC |
28.9 |
|
QLD |
28.4 |
|
SA |
26.0 |
|
TAS |
28.9* |
|
ACT |
34.7* |
|
NT |
29.0* |
|
Australia |
29.7 |
Source: AIHW analysis of NDSHS data – custom report provided to the Commissioner for Children and Young People WA [unpublished]
* Estimate has a relative standard error of 25 per cent to 50 per cent and should be used with caution.
Of the Australian women who did drink alcohol during pregnancy, almost all (96.5%) reported drinking one to two drinks and 90.2 per cent said this was on a monthly basis or less.8
Data from the National Aboriginal and Torres Strait Islander Social Survey (NATSISS) reports that 88.5 per cent of WA mothers of Aboriginal children did not drink alcohol during pregnancy. This was a substantial increase on the prior survey results of 81.1 per cent in 2014-15, however was still one of the lowest proportions across Australia.
|
NSW |
VIC |
QLD |
WA |
SA |
TAS |
ACT |
NT |
Australia |
|
|
2014–15 |
92.4 |
92.2 |
86.2 |
81.1 |
86.9 |
89.9 |
90.9 |
90.4 |
90.9 |
|
2018–19 |
90.5 |
88.5 |
91.0 |
88.5 |
97.1 |
100.0 |
100.0* |
89.7 |
90.2 |
Source: AIHW, Aboriginal and Torres Strait Islander Health Performance Framework, Table D2.21.6: Mother's tobacco, alcohol and drug use during pregnancy, Indigenous children aged 0–3 years, by jurisdiction, 2018–19
* Estimate has a relative standard error between 25 and 50 per cent and should be used with caution.
Note: The ABS do note that alcohol consumption in this survey is likely to be under-reported. Some people who drank alcohol may not have reported it, and some may have reported it but understated the quantity consumed. The extent to which under-reporting has occurred is not able to be quantified.
In WA, health professionals ask mothers about their alcohol consumption while pregnant during antenatal visits. Data on mothers’ responses has been collected and recorded in the WA Department of Health’s Midwives Notification System since July 2017.
This administrative data differs from the NDSHS survey results with a higher proportion of mothers reporting they are not drinking during the pregnancy.
Women in some remote and regional areas are more likely to drink alcohol during pregnancy. Further, Aboriginal women, particularly in the Kimberley and the Pilbara, are more likely to report drinking alcohol during pregnancy.
|
Aboriginal |
Non-Aboriginal |
|||||
|
2017 |
2018 |
2019 |
2017 |
2018 |
2019 |
|
|
North Metropolitan |
91.7 |
93.1 |
96.4 |
98.2 |
98.3 |
98.3 |
|
South Metropolitan |
91.2 |
90.4 |
93.4 |
97.8 |
97.2 |
97.6 |
|
East Metropolitan |
93.5 |
94.3 |
94.0 |
97.5 |
97.9 |
97.8 |
|
Kimberley |
81.1 |
83.7 |
85.2 |
93.5 |
96.4 |
95.6 |
|
Pilbara |
91.6 |
90.4 |
84.4 |
94.9 |
96.0 |
94.6 |
|
Mid West |
86.5 |
87.3 |
90.0 |
97.1 |
98.2 |
94.0 |
|
Wheatbelt |
94.3 |
96.8 |
97.1 |
96.0 |
96.1 |
95.9 |
|
Goldfields |
88.5 |
91.1 |
93.0 |
98.1 |
95.3 |
97.9 |
|
Great Southern |
95.8 |
97.1 |
97.1 |
93.3 |
93.2 |
97.0 |
|
South West |
91.4 |
94.9 |
95.6 |
96.7 |
95.5 |
95.8 |
|
Total |
89.2 |
90.6 |
91.1 |
97.5 |
97.5 |
97.5 |
Source: Custom report provided to the Commissioner for Children and Young People WA by WA Department of Health from the Midwives Notification System and Birth Notification Dataset [unpublished]
In 2019, the lowest proportion of Aboriginal mothers reporting they did not drink alcohol during pregnancy is in the Pilbara (84.4%) and the Kimberley (85.2%). The lowest proportion of non-Aboriginal mothers reporting they did not drink alcohol during pregnancy was also in the Pilbara (94.6%) and the Mid West (94.0%).
There has been little change over the last three years in the proportion of non-Aboriginal mothers reporting drinking during pregnancy.
Since 2017, across WA a greater proportion of Aboriginal mothers report not drinking during pregnancy, except for the Pilbara, where the proportion of Aboriginal women reporting not drinking during pregnancy decreased substantially (from 91.6% in 2017 to 84.4% in 2019).
Proportion of Aboriginal women reporting not drinking alcohol during pregnancy by region, per cent, WA, 2017 to 2019
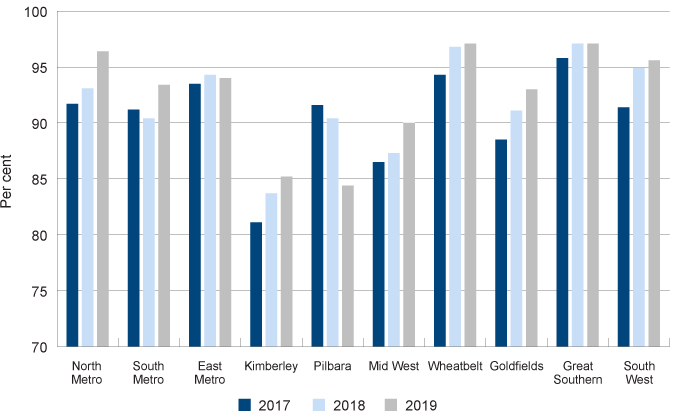
Source: Custom report provided to the Commissioner for Children and Young People WA by WA Department of Health from the Midwives Notification System and Birth Notification Dataset [unpublished]
Women experiencing socioeconomic disadvantage, family violence, mental health issues and low health literacy are more likely to drink during pregnancy.9
Endnotes
- Australian Institute of Family Studies 2018, Fetal alcohol spectrum disorders: Current issues in awareness, prevention and intervention, CFCA Paper No. 29 – December 2014 [website].
- National Health and Medical Research Council 2020, Australian Guidelines to Reduce Health Risks from Drinking Alcohol, Commonwealth of Australia, p. 49-50.
- O’Leary CM et al 2006, A review of policies on alcohol use during pregnancy in Australia and other English-speaking countries, The Medical Journal of Australia, Vol 186, No 9.
- McCarthy FP et al 2013, Association between maternal alcohol consumption in early pregnancy and pregnancy outcomes, Obstetrics & Gynecology, Vol 122, No 4.
- Australian Institute of Health and Welfare 2018, Mothers and babies – Data sources: National data collection on alcohol in pregnancy: a qualitative study [website].
- Australian Institute of Health and Welfare 2020, 2019 National Drug Strategy Household Survey Questionnaire, AIHW.
- Australian Institute of Health and Welfare 2021, AIHW analysis of NDSHS data – custom report provided to the Commissioner for Children and Young People WA [unpublished]
- Australian Institute of Health and Welfare 2020, National Drug Strategy Household Survey 2019, Table 8.15: Quantity and frequency of alcohol consumed, by pregnant women aged 14 to 49 who consumed alcohol during pregnancy, 2013 to 2019, AIHW.
- France KE et al 2010, Health professionals addressing alcohol use with pregnant women in Western Australia: Barriers and strategies for communication, Substance Use and Misuse, Vol 45 No 10.
Not applicable.
Not applicable.
Last updated February 2022
Antenatal care is associated with positive maternal and child health outcomes. Good antenatal care incorporates appropriate health checks and also discussions regarding any recommended lifestyle changes, such as a cessation of smoking or drinking during pregnancy. The likelihood of receiving effective health interventions is increased by attending antenatal visits.
While there has been gradual improvement over recent years, a large proportion of WA mothers (36.9% in 2019) still do not attend an antenatal appointment in the first trimester of their pregnancy. WA has a very low attendance rate compared to the Australian average, in particular, WA mothers in the metropolitan area are much less likely to attend an antenatal appointment in the first trimester. Policy and practice should be focused towards increasing antenatal care attendance of these mothers, particularly those at risk of adverse birth outcomes.
While overall WA has low infant mortality rates (3.1 infant deaths - less than one year of age - per 1,000 live births),1 adverse pregnancy outcomes, including infant death, are more likely for some mothers. Perinatal deaths are almost twice as likely for mothers who live in remote or very remote regions, and 25 per cent more likely for mothers who live in areas of socioeconomic disadvantage.2
Women and families in low socioeconomic areas and remote and regional WA need to have access to high quality antenatal care including appropriate medical care if complications arise.3 Services and programs should be designed to encourage families to access them during pregnancy and ensure ongoing contact with health services and professionals after childbirth. Research shows that women who have continuity of care have better outcomes as they are more likely to attend antenatal appointments, more likely to discuss their pregnancy and lifestyle concerns and to feel well-prepared.4
Lifestyle changes such as reducing or quitting smoking or drinking during pregnancy can be difficult, particularly for women experiencing socioeconomic disadvantage, mental illness or family violence and for some women from Aboriginal communities.5,6 Services and health professionals should provide women with a safe space where they can be encouraged to discuss their lifestyle concerns and consider making changes through behavioural counselling.7 Throughout pregnancy, women should have the opportunity to make informed decisions about their care and treatment in consultation with their healthcare professionals.8 Good communication is essential.
A recent evaluation of the right@home nurse home visiting program, which offered pregnant women experiencing adversity in Victoria and Tasmania 25 nurse visits at home until the child was aged two years, found that the program improved parenting and home environment determinants of children’s health and development. Programs of this nature should be considered for mothers deemed at risk.9
Aboriginal mothers in WA are much less likely to attend an antenatal appointment in the first trimester than non-Aboriginal mothers. It is therefore critical that antenatal services are culturally appropriate and accessible, particularly considering the needs of Aboriginal mothers and families. Factors that improve Aboriginal women’s engagement with antenatal care include:10
- creating an effective relationship between the woman and the health provider
- supporting the woman’s individual decision-making
- culturally competent carers and models of care
- maintaining a holistic approach to health which incorporates Aboriginal understandings of health including social, emotional, spiritual, and cultural wellbeing.11
Provision of universal services for all families, linked to specific targeted services for families with additional needs, will result in improved maternal and infant health.
Data gaps
The data on antenatal visits is not complete as first antenatal visits that occur outside of hospital may not be included. The method of data collection should be reviewed and improved to ensure accurate reporting on low attendance rates to focus policy and practice changes in the right area.
Endnotes
- Australian Institute of Health and Welfare 2018, Children’s Headline Indicators – Infant Mortality, AIHW [website].
- Australian Institute of Health and Welfare 2021, Stillbirths and neonatal deaths in Australia 2017 and 2018, Perinatal statistics series no 38, Cat no PER 115, AIHW, p. 9.
- Reibel T and Morrison L 2014, Young Aboriginal Women’s Voices on Pregnancy Care, Telethon Kids Institute and the University of WA, WA Department of Health, p. 12.
- McLean K, Goldfeld S, Molloy C and Wake M 2014, Screening and surveillance in early childhood health: Rapid review of evidence for effectiveness and efficiency of models; Murdoch Children Research Institute, p. 6.
- Mendelsohn CP et al 2014, Management of smoking in pregnant women, Australian Family Physician, Vol 43, No 1–2.
- France KE et al 2010, Health professionals addressing alcohol use with pregnant women in Western Australia: Barriers and strategies for communication, Substance Use and Misuse, Vol 45 No 10.
- Mendelsohn CP et al 2014, Management of smoking in pregnant women, Australian Family Physician, Vol 43, No 1–2.
- National Collaborating Centre for Women's and Children's Health (UK) 2008, Chapter 3 Women-centred care and informed decision making in Antenatal Care: Routine Care for the Healthy Pregnant Woman - NICE Clinical Guidelines, No. 62, Royal College of Obstetricians and Gynaecologists Press, [website], viewed 8 November 2018.
- Goldfeld S et al 2019, Nurse Home Visiting for Families Experiencing Adversity: A Randomized Trial, Pediatrics, Vol 143, no 1.
- Reibel T and Morrison L 2014, Young Aboriginal Women’s Voices on Pregnancy Care, Telethon Kids Institute and the University of WA, WA Department of Health, p. 13.
- Kruske S et al 2006, Cultural safety and maternity care for Aboriginal and Torres Strait Islander Australians, Women and Birth: Journal of the Australian College of Midwives. Vol 3 No 73.
For more information on antenatal care refer to the following resources:
- Australian Institute of Health and Welfare 2021, Australia’s mothers and babies 2019 , Cat No PER 101, AIHW.
- Australian Institute of Health and Welfare 2021, Aboriginal and Torres Strait Islander Health Performance Framework 2020: Antenatal care, AIHW [online].
- Department of Health, Clinical Practice Guidelines – Pregnancy Care: 2018 Edition, Australian Government.