


Safe in the home

Feeling safe and being safe at home is critical for young people’s healthy development. A safe and supportive family provides a sense of security, fosters self-esteem and responds appropriately to young people’s needs.1
Young people who experience family violence, abuse and neglect are more likely to have poor outcomes including poor physical health, learning and developmental difficulties, higher rates of alcohol and substance abuse, mental illness, criminality, homelessness, later parenting issues and suicide.2
Last updated August 2020
Some data is available on whether WA young people aged 12 to 17 years feel safe and are safe in their homes.
Overview
This indicator considers some key measures on whether young people feel safe and are safe at home. This includes data on family and domestic violence and the child protection system in WA.
Areas of concern
In the Speaking Out Survey 2019, a significant proportion (37.2%) of young people aged 12 to 17 years said they do not always feel safe at home.
There is limited data on the prevalence of abuse and neglect impacting young people in WA. It is expected that this this gap will be at least partially addressed by the Australian Child Maltreatment Study funded by the National Health and Medical Research Council.
In 2017, 1,674 incidents (6.3% of all incidents) were recorded by WA Police with WA children and young people aged 10 to 17 years as victims of family violence.
At 30 June 2019, the rate of WA Aboriginal children and young people being in out-of-home care was 64.1 per 1,000 children, 17 times the rate for WA non-Aboriginal children (3.8 per 1,000).
Other measures
Injuries and poisoning are major causes of hospitalisation for children and young people in Australia. A measure on child deaths or injuries has not been selected for the Indicators of wellbeing as data is regularly compiled by Kidsafe WA and the WA Ombudsman.
For information on child deaths refer to the Ombudsman’s annual Child Death Review. For information on injuries for children refer to Kidsafe WA Childhood Injury Bulletins & Reports. For information on young people aged 12 to 17 years engaging in self-harm refer to the Mental health indicator.
Last updated August 2020
Young people in this age group experience various physical, cognitive and emotional changes related to the transition to adulthood. Strong and positive relationships in the home are protective against a range of behaviours that can affect young people during adolescence, including mental health issues, drug and alcohol misuse and unsafe sexual activity.1,2 Feeling safe and supported in the home is also essential to allow young people to develop confidence and independence while being protected from harm.
When young people feel unsafe in the home they are more likely to have poor physical and mental health, poor academic outcomes and are more likely to engage in risk-taking behaviours.3,4
While some young people do not feel safe at home because they are experiencing abuse and neglect, other young people may not feel safe at home due to parental conflict, sibling bullying,5 being left home alone,6 parental rejection of their lesbian, gay, bisexual, trans or intersex (LGBTI7) status and/or excessive parental control being exerted over their lives.8,9,10
Families can often experience conflict during the adolescent years and it can be challenging for parents and young people to successfully manage and resolve these conflicts. In some circumstances, young people feel so unsafe or unsupported at home that they may leave home, which can result in them becoming homeless.
In WA in 2018–19, 768 young people aged 15 to 17 years presented alone to homelessness services.11 In a survey of homeless young people in Australia, more than one-half (56.0%) had left home because of violence between parents or guardians on at least one occasion.12
Other research suggests that some young people do not leave home, but continue to feel unsafe and unsupported in their home. This can include young women from some culturally and linguistically diverse (CALD) communities whose families may limit their ability to participate in the Australian community in the way they would like.13
Young people may also not feel safe at home due to negative online experiences including cyberbullying. This is discussed in the Safe in the community indicator.
In 2019, the Commissioner for Children and Young People (the Commissioner) conducted the Speaking Out Survey which sought the views of a broadly representative sample of 4,912 Year 4 to Year 12 students in WA on factors influencing their wellbeing, including a range of questions about feeling safe at home.
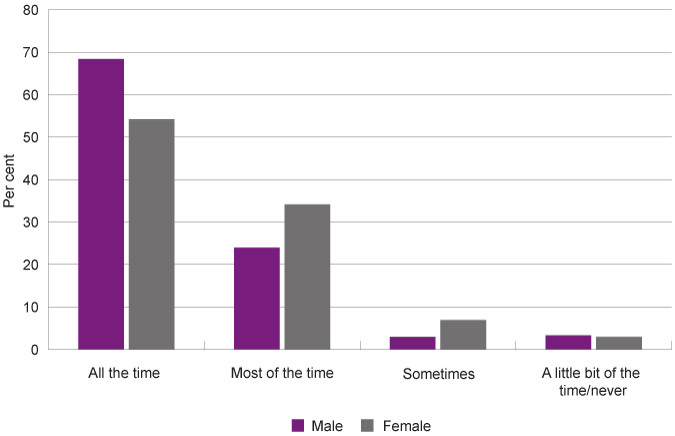
For students in Year 7 to Year 12, 61.2 per cent reported they felt safe at home all the time and 29.0 per cent felt safe most of the time, while 3.3 per cent of students reported feeling safe at home only a little bit of the time or never.
|
Male |
Female |
Metropolitan |
Regional |
Remote |
All |
|
|
All the time |
68.4 |
54.2 |
60.6 |
61.9 |
68.5 |
61.2 |
|
Most of the time |
24.0 |
34.2 |
29.9 |
26.1 |
23.8 |
29.0 |
|
Sometimes |
3.0 |
6.9 |
4.7 |
5.7 |
5.7 |
4.9 |
|
A little bit of the time |
2.5 |
2.2 |
2.4 |
2.6 |
1.8 |
2.4 |
|
Never |
0.8 |
0.8 |
0.8 |
1.6 |
N/A |
0.9 |
|
Prefer not to say |
0.4 |
0.9 |
0.6 |
1.2 |
N/A |
0.6 |
Source: Commissioner for Children and Young People WA 2020, Speaking Out Survey 2019 Data Tables [unpublished]
N/A – Cells are suppressed where the number of students providing data for that response was less than 5.
Just over one-half (54.2%) of female Year 7 to Year 12 students feel safe at home all the time, while one-third (34.2%) feel safe at home most of the time. This represents a significantly lower proportion of female Year 7 to Year 12 students than male students who report feeling safe all the time (54.2% compared to 68.4%). This also represents a significant decline from the proportion of Year 4 to Year 6 female students who feel safe at home all the time (65.5%).14
Proportion of Year 7 to Year 12 students reporting they feel safe at home all of the time, most of the time, sometimes, a little bit of the time, never by gender, per cent, WA, 2019
Source: Commissioner for Children and Young People WA 2020, Speaking Out Survey 2019 Data Tables [unpublished]
A significantly higher proportion of Year 7 to Year 12 students in remote areas compared to metropolitan and regional areas feel safe at home all the time (68.5% compared to 60.6% and 61.9%).
A marginally higher proportion of Aboriginal Year 7 to Year 12 students than non-Aboriginal students reported feeling safe at home all the time (64.2% compared to 61.0%). These differences are not statistically significant.
|
Aboriginal |
Non-Aboriginal |
|
|
All the time |
64.2 |
61.0 |
|
Most of the time |
24.8 |
29.3 |
|
Sometimes |
5.3 |
4.9 |
|
A little bit of the time |
1.8 |
2.4 |
|
Never |
1.2 |
0.9 |
|
Prefer not to say |
N/A |
0.6 |
Source: Commissioner for Children and Young People WA 2020, Speaking Out Survey 2019 Data Tables [unpublished]
N/A – Cells are suppressed where the number of students providing data for that response was less than 5.
The survey also included a question asking Year 7 to Year 12 students whether they had ever stayed away from home overnight because of a problem.
|
Male |
Female |
Metropolitan |
Regional |
Remote |
All |
|
|
No |
73.1 |
58.3 |
67.7 |
56.3 |
56.0 |
65.5 |
|
Yes |
23.7 |
36.3 |
28.3 |
38.1 |
39.0 |
30.3 |
|
Prefer not to say |
3.2 |
5.4 |
3.9 |
5.5 |
5.0 |
4.2 |
Source: Commissioner for Children and Young People WA 2020, Speaking Out Survey 2019 Data Tables [unpublished]
Thirty per cent of Year 7 to 12 students (30.3%) reported they had ever stayed away from home overnight because of a problem. A significantly higher proportion of female than male students reported they had ever done this (36.3% female compared to 23.7% male).
A lower proportion of students in the metropolitan area than non-metropolitan areas had stayed away from home overnight because of a problem (28.3% compared to 38.1% regional and 39.0% remote).
Among the students in Year 7 to Year 12 who reported they had stayed away from home overnight, 35.6 per cent reported they had done this once and 31.7 per cent reported they had done this more than once in the last 12 months. A significantly higher proportion of female students than male students reported they did this more than once in the last 12 months (39.1% female compared to 22.0% male).15
Students were also asked whether they worried about family members being harmed or harming someone else. The majority of students in Year 7 to Year 12 did not worry that someone in their home or family will hurt themselves (63.4%) or hurt somebody else (67.0%). Conversely, 20.0 per cent of students worried a lot or somewhat that someone in their house will hurt themselves and 18.4 per cent worried a lot or somewhat that someone in their home or family may hurt someone else.
|
Hurt themselves |
Hurt somebody |
|||||
|
Male |
Female |
All |
Male |
Female |
All |
|
|
Not at all |
68.0 |
59.3 |
63.4 |
70.2 |
63.9 |
67.0 |
|
A little |
16.2 |
16.8 |
16.6 |
14.2 |
15.1 |
14.6 |
|
Somewhat |
8.5 |
12.2 |
10.3 |
8.7 |
10.2 |
9.6 |
|
A lot |
7.3 |
11.8 |
9.7 |
6.9 |
10.7 |
8.8 |
Source: Commissioner for Children and Young People WA 2020, Speaking Out Survey 2019 Data Tables [unpublished]
A significantly lower proportion of Year 7 to Year 12 female students than male students never worried about someone in their family hurting themselves (59.3% compared to 68.0%), while 11.8 per cent of female students worried a lot about this (compared to 7.3% of male students).
There were no significant differences in responses between geographic locations or Aboriginal and non-Aboriginal students for either question.16
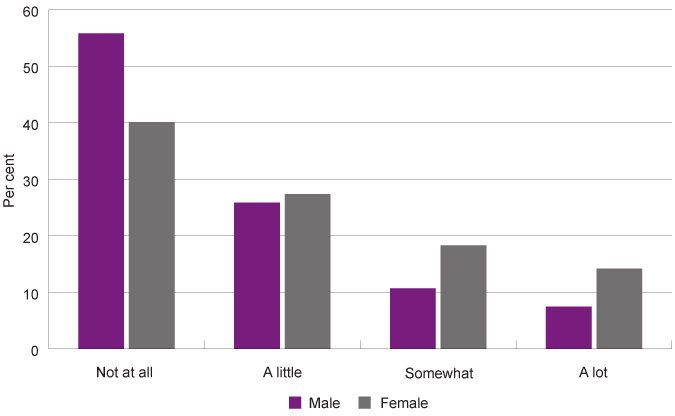
Students were also asked whether they worried that someone in their home or family will be fighting. A significantly lower proportion of female Year 7 to Year 12 students than male students never worried about this (40.1% compared to 55.8%).
|
Male |
Female |
Metropolitan |
Regional |
Remote |
All |
|
|
Not at all |
55.8 |
40.1 |
47.2 |
50.4 |
50.9 |
47.8 |
|
A little |
25.9 |
27.4 |
27.3 |
22.3 |
29.3 |
26.7 |
|
Somewhat |
10.7 |
18.3 |
14.7 |
15.0 |
8.2 |
14.4 |
|
A lot |
7.5 |
14.2 |
10.8 |
12.4 |
11.5 |
11.0 |
Source: Commissioner for Children and Young People WA 2020, Speaking Out Survey 2019 Data Tables [unpublished]
Proportion of Year 7 to Year 12 students reporting they worry a lot, somewhat, a little or not at all that someone in their home or family will be fighting by gender, per cent, WA, 2019
Source: Commissioner for Children and Young People WA 2020, Speaking Out Survey 2019 Data Tables [unpublished]
Almost one-third (32.5%) of female students worried somewhat or a lot about someone in their home or family fighting, this increased from 19.6 per cent of Year 4 to Year 6 female students (male Year 7 to Year 12: 18.2%, male Year 4 to Year 6: 17.4%).17
There were no significant differences reported between geographic locations or Aboriginal and non-Aboriginal Year 7 to Year 12 students.
These perceptions of safety in the home provide a critical insight into young people’s views and concerns, however more research is required to determine what drives these perceptions and how they relate to experiences of harm.
In the annual Mission Australia 2019 Youth Survey, 25,126 Australian young people aged 15 to 19 years responded to questions across a broad range of topics including education and employment, participation in community activities, general wellbeing, values and concerns and preferred sources of support.
The 2019 sample included 2,766 young people from WA.18 One-half of WA respondents (50.3%) were male and 45.8 per cent were female with remainder choosing either ‘other or ‘preferred not to say’. Aboriginal and/or Torres Strait Islander young people comprised 5.9 per cent of WA respondents.19
The 2019 survey asked respondents about issues that concern them the most, including family conflict and family and domestic violence. The question did not specify whether participants were concerned about family conflict and/or violence in their own home or concerned more broadly about its occurrence in society.
|
Australia |
WA |
||
|
Family conflict |
Not at all concerned |
44.8 |
45.7 |
|
Slightly concerned |
19.9 |
18.5 |
|
|
Somewhat concerned |
17.1 |
16.7 |
|
|
Very concerned |
11.1 |
11.6 |
|
|
Extremely concerned |
7.1 |
7.5 |
|
|
Family and domestic violence |
Not at all concerned |
71.1 |
70.8 |
|
Slightly concerned |
11.0 |
9.8 |
|
|
Somewhat concerned |
8.7 |
8.5 |
|
|
Very concerned |
5.0 |
5.5 |
|
|
Extremely concerned |
4.2 |
5.4 |
|
Source: Mission Australia, Youth Survey Report 2019
The results showed that 19.1 per cent of WA participants were very or extremely concerned about family conflict and 10.9 per cent were very or extremely concerned about family and domestic violence. WA participants were slightly more concerned about both these issues than Australian respondents overall.
|
Family conflict |
Family and domestic violence |
|||
|
Female |
Male |
Female |
Male |
|
|
Extremely concerned |
10.6 |
3.9 |
7.1 |
2.9 |
|
Very concerned |
15.4 |
8.5 |
6.7 |
4.5 |
|
Total |
26.0 |
12.4 |
13.8 |
7.4 |
Source: Mission Australia, Youth Survey Report 2019
Female respondents were significantly more likely than male respondents to report feeling very or extremely concerned about family conflict (26.0% female compared to 12.4% male) and family and domestic violence (13.8% female compared to 7.4% male).20
Endnotes
- Robinson E 2006, Young people and their parents: Supporting families through changes that occur in adolescence, Australian Family Relationships Clearinghouse, Australian Institute of Family Studies.
- Moretti MM 2004, Adolescent-parent attachment: Bonds that support healthy development, Paediatrics Child Health, Vol 9, No 8.
- Kaspiew R et al 2017, Domestic and family violence and parenting: Mixed method insights into impact and support needs: Final report, Australia’s National Research Organisation for Women’s Safety (ANROWS), p. 23.
- Lepisto S et al 2011, Witnessing and experiencing domestic violence: a descriptive study of adolescents, Scandinavian Journal of Caring Sciences, Vol 25.
- Dantchev S and Wolke D 2019, Trouble in the nest: Antecedents of sibling bullying victimization and perpetration, Developmental Psychology, Vol 55, No 5.
- Child Family Community Australia 2014, Leaving a child home alone: Considerations for parents and professionals, Australian Institute of Family Studies.
- The Commissioner’s office uses the broad term LGBTI to inclusively refer to all people who are lesbian, gay, bisexual, trans and have an intersex variation, as well as to represent other members of the communities that use different terms to describe their diverse sexuality and/or gender.
- National Youth Commission 2008, Australia’s Homeless Youth: a report of the National Youth Commission Inquiry into Youth Homelessness, Australian Government, p. 87-90.
- Durso LE and Gates GJ 2012, Serving Our Youth: Findings from a National Survey of Service Providers Working with Lesbian, Gay, Bisexual, and Transgender Youth who are Homeless or At Risk of Becoming Homeless, The Williams Institute with True Colors Fund and The Palette Fund, p. 4.
- Morton M et al 2018, Prevalence and Correlates of Youth Homelessness in the United States, Journal of Adolescent Health, Vol 62.
- Australian Institute of Health and Welfare 2020, Specialist Homelessness Services Collection data cubes 2011–19, SHSC Demographics data cube, AIHW.
- MacKenzie D et al 2016, The Cost of Youth Homelessness in Australia: Research Briefing, Swinburne University of Technology et al, p. 2, 11.
- Child Family Community Australia (undated), Working with culturally and linguistically diverse (CALD) adolescents, Australian Institute of Family Studies.
- Commissioner for Children and Young People WA 2020, Speaking Out Survey 2019 Data Tables, Commissioner for Children and Young People WA [unpublished].
- Ibid.
- Ibid.
- Commissioner for Children and Young People WA 2020, Speaking Out Survey 2019 Data Tables, Commissioner for Children and Young People WA [unpublished].
- Carlisle E et al 2019, Youth Survey Report 2019, Mission Australia, p. 192. Note: Mission Australia recommend caution when interpreting and generalising the results for certain states or territories because of the small sample sizes and the imbalance between the number of young females and males participating in the survey.
- Ibid, p. 192.
- Ibid, p. 201-202.
Last updated August 2020
Every child or young person has a right to live free from violence, abuse and neglect.1 Most young people live in safe and supportive homes, however for some, home can be a place of conflict and distress as a result of family and domestic violence.
There is considerable overlap between children and young people being exposed to family and domestic violence and the child protection system. When a physical assault on a child or young person is reported, WA Police will make an assessment about whether to involve child protection authorities through a formal notification. The Department for Communities then determines whether a child/young person has suffered significant harm or is likely to suffer significant harm as a result of exposure to family and domestic violence.2
The next measure (Involved in the child protection system) records child protection service responses, including notifications, substantiations and children in care.
Family and domestic violence can be defined as ‘abusive behaviour in an intimate relationship or other type of family relationship where one person assumes a position of power over another and causes fear’.3 Abusive behaviour can include physical abuse or verbal, mental or emotional abuse or control. For young people it is often perpetrated by parents/carers, however, perpetrators can also be siblings and other family members such as step-fathers.
Living with family and domestic violence has short and long-term impacts on children and young people’s health and wellbeing. These include mental health issues such as anxiety and depression, difficulties at school, behavioural issues including violent behaviour, a higher likelihood of alcohol and drug misuse and greater risk of homelessness.4,5
Research also suggests that family and domestic violence can impact a parent’s ability to parent effectively.6
The causes of family and domestic violence are complex. Violence against women is linked to gender inequality reinforced through gender-based stereotypes. It is therefore critical to collect data on children and young people’s understanding of gender equality and violence against women.
The National Community Attitudes towards Violence against Women Survey (NCAS) was conducted in 2017 and reported on young people’s (aged 16 to 24 years) attitudes to violence against women and gender equality.7
This survey found that most young people aged 16 to 24 years have a good knowledge of key aspects of violence against women, support gender equality, reject attitudes supportive of violence against women, and say they would act or like to act if they witnessed abuse or disrespect of women.9 However, there has been a decline in the number of Australian young people who recognise that men more often commit acts of domestic violence (71.0% in 2009, 75.0% in 2013 and only 60.0% in 2017).9
At the same time, over one in three (36.0%) young Australians stated they would not know where to get outside help for a domestic violence issue.10
Young people can also be perpetrators of family or domestic violence, either towards parents, siblings or intimate partners.11 Research suggests that most incidents of violence by young people in the home are committed by male adolescents against their mothers.12
In 2017, there were 600 incidents of family violence reported to WA Police where an offender was processed and was under 18 years of age. Of these, 69.2 per cent (415) were male young people.13 Data is not available on the age of the victim or whether the offender was in the family home or living independently.
For more information on adolescent violence in the home refer to:
Broadhead S and Francis R 2015, The Making of Good Men and Women, Summary Report: Responding to Youth Violence in the Home and its harmful impacts on families and communities in Western Australia, The Making of Good Men and Women Working Group.
Children and young people experiencing family and domestic violence as onlookers
Experiencing family and domestic violence involves children and young people not only being subject to family and domestic violence, but also witnessing family and domestic violence. Research has shown that the existence of violent behaviour in the home increases the likelihood of trauma and negative health and wellbeing outcomes.14,15,16
The WA Police Force (WA Police) collect data on whether children and young people are present at family violence-related incidents.17
Almost one-half of all family violence-related crime incidents reported, or becoming known, to WA Police between 2014 and 2017 had at least one child or young person present.
|
2014 |
2015 |
2016 |
2017 |
|
|
Number of FV crime incidents |
21,641 |
26,913 |
31,316 |
28,716 |
|
Number of distinct FV crime incidents |
10,047 |
12,132 |
14,081 |
12,726 |
|
Proportion of incidents where |
46.4 |
45.1 |
45.0 |
44.3 |
Source: WA Police custom report of FV incidents recorded in the Incident Management System (IMS) where at least one child was present, provided to the Commissioner for Children and Young People WA
* A child or young person aged 0 to 17 years.
Notes:
1. Crime incidents are recorded in the IMS where one or more valid offences are suspected to have occurred.
2. The family violence data is collected using the family violence (FV) flag in police systems. WA Police select the FV flag at the victim level when they have determined an offence or incident to be FV-related as defined by the relevant state legislation (Refer to ABS 4510.0 - Recorded Crime - Victims, Australia, 2018 – Explanatory Notes for more information).
3. Reporting on family violence by WA Police changed from 1 July 2017 due to changes in the legislation, for more information refer to: The Restraining Orders and Other Legislation Amendment (Family Violence) Bill 2016.
In 2017, at least one child or young person (aged 0 to 17 years) was present at 12,726 reported incidents of family violence across WA.
In the Australian Bureau of Statistics (ABS) Personal Safety Survey, 68.0 per cent of Australian women and 60.0 per cent of Australian men who had children in their care when they experienced intimate partner violence reported that the children had seen or heard the violence.18
The proportion of family violence crime incidents where a child was present varies between WA regions and districts with the Wheatbelt and South West districts having the highest proportions followed by the Metropolitan region.
|
Total incidents |
Total incidents |
Proportion of incidents |
|
|
Central Metropolitan |
4,018 |
1,746 |
43.5 |
|
North West Metropolitan |
4,249 |
2,064 |
48.6 |
|
South East Metropolitan |
4,539 |
2,162 |
47.6 |
|
South Metropolitan |
5,061 |
2,506 |
49.5 |
|
Metropolitan region |
17,867 |
8,478 |
47.5 |
|
Goldfields-Esperance |
1,254 |
469 |
37.4 |
|
Great Southern |
891 |
388 |
43.5 |
|
Kimberley |
3,427 |
1,017 |
29.7 |
|
Mid West-Gascoyne |
1,615 |
750 |
46.4 |
|
Pilbara |
1,720 |
643 |
37.4 |
|
South West |
1,336 |
667 |
49.9 |
|
Wheatbelt |
606 |
314 |
51.8 |
|
Regional WA total |
10,849 |
4,248 |
39.2 |
|
Total incidents |
28,716 |
12,726 |
44.3 |
Source: WA Police custom report of FV crime incidents recorded in the Incident Management System (IMS), provided to the Commissioner for Children and Young People WA
Note: District is based on the location of the offence.
It should be noted that this data is the raw numbers of incidents without the commensurate population and therefore does not provide the rates of occurrence by area.
Children and young people experiencing family and domestic violence as direct victims
In 2017, 1,674 crime incidents19 (6.3% of all FV-related crime incidents) were reported, or became known, to WA Police with WA children and young people aged 10 to 17 years as one of the victims of family violence.
|
Number |
Per cent of total |
|
|
0 to 9 years |
562 |
2.1 |
|
10 to 17 years |
1,674 |
6.3 |
|
18 to 24 years |
4,395 |
16.5 |
|
25 to 44 years |
15,186 |
56.9 |
|
45 to 64 years |
5,709 |
21.4 |
|
65+ years |
766 |
2.9 |
Source: WA Police custom report of FV crime incidents recorded in the Incident Management System (IMS), provided to the Commissioner for Children and Young People WA
Note: Values are a distinct count/ distinct per cent of incidents by demographics and offence location. As an incident may have multiple victims recorded across all demographics, the figures should not be summed.
It should be noted that WA Police are only able to record incidents detected and/or reported to them. There is clear evidence that family violence incidents are under-reported.20
In 2016, the Australian Bureau of Statistics (ABS) asked adult survey respondents to the Personal Safety Survey about experiences of childhood abuse (before 15 years of age). According to this survey, 13.0 per cent (2.5 million) of Australian adults have experienced childhood abuse. The majority of people experienced only one type of abuse; 5.8 per cent of respondents had experienced physical abuse, 5.0 per cent experienced sexual abuse and 2.7 per cent had experienced both.21
Based on this survey, an estimated one in 12 children and young people experienced physical abuse and one in 13 experienced sexual abuse before 15 years of age. Most adults who reported they were abused as children experienced their first incident before the age of 10.22
An estimated 81.0 per cent of people who experienced childhood physical abuse were first abused by a family member (78.0% were first abused by a parent). While, an estimated 51.0 per cent of people who experienced childhood sexual abuse were first abused by a non-familial known person (35.6% were abused by a family member).23
Analysis by the ABS showed that 71.0 per cent of people who experienced abuse as a child also experienced violence as an adult, compared to 33.0 per cent of those who did not experience childhood abuse.24
The ABS annually reports data on victims of family and domestic violence through the Recorded Crimes – Victims collection gathered from police agencies within each Australian jurisdiction.25
In 2019, 1,793 WA young people aged 15 to 19 years were reported as victims of family and domestic violence, physical and sexual assault.
|
2014 |
2015 |
2016 |
2017 |
2018 |
2019 |
Per cent change since 2014 |
||
|
0 to 9 years* |
Physical assault |
218 |
274 |
314 |
342 |
342 |
351 |
61.8 |
|
Sexual assault |
140 |
126 |
139 |
192 |
134 |
142 |
- |
|
|
Total |
359 |
400 |
451 |
536 |
476 |
493 |
37.3 |
|
|
10 to 14 years* |
Physical assault |
383 |
469 |
559 |
538 |
531 |
556 |
45.2 |
|
Sexual assault |
130 |
89 |
113 |
152 |
140 |
168 |
29.2 |
|
|
Total |
513 |
558 |
670 |
690 |
671 |
724 |
41.1 |
|
|
15 to 19 years* |
Physical assault |
1,380 |
1,619 |
1,767 |
1,492 |
1,529 |
1,658 |
20.1 |
|
Sexual assault |
108 |
106 |
104 |
100 |
148 |
135 |
25.0 |
|
|
Total |
1,488 |
1,725 |
1,867 |
1,591 |
1,677 |
1,793 |
20.5 |
|
Source: Australian Bureau of Statistics, Recorded Crime - Victims, Australia, 2019, Table 24 and 25 Victims of Family and Domestic violence-related assault/sexual assault, Selected characteristics, Selected states and territories, 2014–2019
* The age groupings are not equal – 0 to 9 years reports on 10 years, 10 to 14 years reports on 5 years and 15 to 19 years reports on 4 years.
Note: This data differs from the previous table as it includes only physical and sexual assault, compared to all incidents categorised as family and domestic violence.
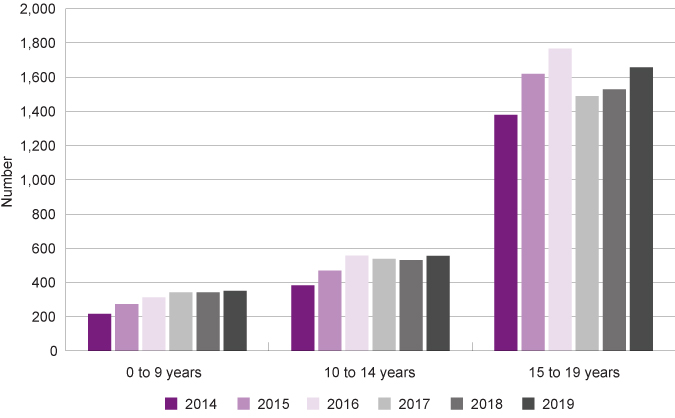
Victims of family and domestic violence physical assault by age group, number, WA, 2014 to 2019
Source: Australian Bureau of Statistics, Recorded Crime - Victims, Australia, 2019, Table 24 Victims of Family and Domestic violence-related assault, Selected characteristics, Selected states and territories, 2014–2019
Since 2014, there has been an increase in the number of WA children and young people reported as victims of family and domestic violence physical assaults across all age groups, although for young people aged 15 to 19 years there was a decrease from 2016 to 2017.
Sexual assault that is family violence-related has increased by 29.2 per cent since 2014 for children and young people aged 10 to 14 years (from 130 children in 2014 to 168 in 2019) and by 25.0 per cent for young people aged 15 to 19 years (from 108 in 2014 to 135 victims in 2019).
It is not known whether these changes represent a change in the rate of occurrence or is due to other factors, including the population increasing or varying rates of reporting to WA Police.
Sexual assault is much less likely to be reported to the police for multiple reasons including the victim feeling shame, stigma, concern about whether they will be believed and sometimes fear of the perpetrator.26
It should be noted that if a sexual assault is reported for a child or young person under 18 years of age, WA Police must report this to the Department of Communities under the mandatory reporting regime.27
|
Physical assault |
Sexual assault |
|||
|
10 to 14 years |
15 to 19 years |
10 to 14 years |
15 to 19 years |
|
|
Male |
252 |
365 |
32 |
12 |
|
Female |
293 |
1,282 |
132 |
122 |
|
Total |
556 |
1,658 |
168 |
135 |
Source: Australian Bureau of Statistics, Recorded Crime - Victims, Australia, 2019, Table 24 and 25 Victims of Family and Domestic violence-related assault/sexual assault, Selected characteristics, Selected states and territories, 2014–2019
Note: The ABS notes that totals may not sum due to perturbation.
WA young women aged 15 to 19 years are significantly more likely than young men to be the victims of physical assault as a result of family and domestic violence (1,282 female young people compared to 365 male young people). This may be due to young women aged 15 to 19 years being more likely than young men to be assaulted by intimate partners.28
Data from the ABS Personal Safety Survey shows that parents are the most common perpetrators of physical abuse of children younger than 15 years. Respondents to the survey were asked whether they experienced abuse before the age of 15 years. Of those who were victims of abuse before the age of 15 years, around 42.0 per cent were victims of physical abuse by a father or stepfather, and 22.0 per cent by a mother or stepmother.29 Approximately six per cent were abused by a sibling (which can include an adult sibling).30 A significant proportion were also abused by another ‘known person’.
Research indicates that women in regional, rural and remote areas are more likely to be victims of family and domestic violence.31,32 Across Australia, 23.0 per cent of women living outside major cities reported experiencing partner violence compared with 15.0 per cent living in major cities.33
There is no comparable research on the experiences of children and young people in regional and remote locations.
The cultural and social characteristics of regional and remote communities can influence the prevalence of domestic and family violence. Some of these factors include more traditional gender norms, a lack of access to appropriate services due to greater isolation and, for some communities, a greater focus on privacy and self-reliance.34
Data from the ABS 2014–15 National Aboriginal and Torres Strait Islander Social Survey (NATSISS) shows that there is a higher rate of family and domestic violence in Aboriginal families than non-Aboriginal families across Australia.35 This should be understood in the context of a history of colonisation, forced child removal, social disadvantage and intergenerational trauma.36
Aboriginal Australians are also more likely to have increased risk factors for family violence such as poor and overcrowded housing, higher levels of poverty, lower education and higher unemployment.37
The ABS collection on Recorded Crime – Victims does not report on data for Aboriginal peoples in WA as the data is not of sufficient quality.38 Furthermore, the NATSISS survey does not provide jurisdictional level data and no data on children and young people’s experiences of family and domestic violence.39
In the Longitudinal Study of Aboriginal Children participating families were asked about family violence, and families living in remote areas were significantly more likely to rate family violence as a big problem in the community.40
There is no data available on children and young people’s exposure to family and domestic violence in culturally and linguistically diverse (CALD) communities, although research suggests that women in CALD communities are particularly vulnerable to experiencing domestic and family violence.41,42
There are many barriers that prevent CALD families from reporting violence and accessing services or support, including language difficulties, cultural differences regarding asking for help, and isolation due to separation from other family and friends.43
The experiences of CALD children and young people can differ to the experiences of Anglo‐Australian children because of trauma related to their pre‐migration and migration experiences, racism and discrimination, and the normalisation of certain cultural beliefs regarding gender equality.44
Considering their high risk of exposure, the lack of data and research with Aboriginal and CALD children and young people experiencing family and domestic violence is a significant gap.
Family violence-related homicide
In a small but critical number of cases family and domestic violence results in the tragic death of the victim or victims. Relative to other Australian jurisdictions for which data is available, a high number of WA people were murdered in a family and domestic violence incident in 2016 and 2018, however there were significantly fewer deaths in 2019.
|
2016 |
2017 |
2018 |
2019 |
|
|
NSW |
43 |
28 |
37 |
38 |
|
VIC |
40 |
35 |
33 |
36 |
|
QLD |
37 |
27 |
20 |
20 |
|
SA |
16 |
22 |
12 |
14 |
|
WA |
37 |
13 |
38 |
12 |
Source: Australian Bureau of Statistics, Recorded Crime - Victims, Australia, 2019,Table 23 Victims of Family and Domestic violence-related homicide, Selected characteristics, Selected states and territories, 2014–2019
Furthermore, in 2019, no WA children and young people (aged 0 to 19 years) lost their lives due to family and domestic violence-related homicide (compared to 13 children and young people in 2018).45
From 30 June 2009 to 30 June 2019, family and domestic violence was the leading social and environmental factor that was associated with 72.0 per cent of investigable46 child deaths in WA.47
Across Australia, around 10.0 per cent of Australian homicide victims are children and young people aged 0 to 17 years. The majority are victims of filicide (murdered by their parents).48
Endnotes
- Article 19 of the United Nations Convention on the Rights of the Child [website].
- Child abuse includes emotional abuse where young people are exposed to family and domestic violence as onlookers and they are deemed at risk of significant emotional/mental harm. When a physical assault on a child or young person is reported, the officer in charge will make an assessment about whether to involve child protection authorities. The Department for Communities then determines whether a child has suffered significant harm or is likely to suffer significant harm as a result of exposure to family and domestic violence. Significant harm or likelihood of significant harm may be caused by a single act of family and domestic violence or the cumulative impact of exposure over a period of time. Source: WA Department for Child Protection and Family Support (now Communities) 2014, Emotional abuse – Family and domestic violence policy, WA Government. If a sexual assault is reported for a child or young person under 18 years of age, the police officer in charge must report this to the Department of Communities under the mandatory reporting regime.
- QLD Department of Child Safety 2018, Domestic and family violence and its relationship to child protection – practice paper, QLD Government, p. 3.
- Campo M 2015, Children’s exposure to domestic and family violence: CFCA Paper No. 36, Australian Institute of Family Studies, p. 6
- Richards K 2011, Children’s exposure to domestic violence in Australia, Trends and issues in crime and criminal justice, No 419, Australian Institute of Criminology, p. 3.
- Kaspiew R et al 2017, Domestic and family violence and parenting: Mixed method insights into impact and support needs: Final report, Australia’s National Research Organisation for Women’s Safety (ANROWS).
- Politoff V et al 2019, Young Australians’ attitudes to violence against women and gender equality: Findings from the 2017 National Community Attitudes towards Violence against Women Survey (NCAS), Australia’s National Research Organisation for Women’s Safety (ANROWS) Insights, Issue 01/2019, ANROWS.
- Ibid, p. 6.
- Ibid, p. 21.
- Ibid, p. 20.
- Howard J 2015, Adolescent violence in the home: How is it different to adult family violence?, Child Family Community Australia, Australian Institute of Family Studies.
- Howard J 2011, Adolescent violence in the home – the missing link in family violence prevention and response, Australian domestic and family violence clearinghouse.
- Custom report of Family Violence crime incidents reported to WA Police provided to the Commissioner for Children and Young People WA by WA Police.
- Campo M 2015, Children’s exposure to domestic and family violence: CFCA Paper No. 36, Australian Institute of Family Studies, p. 6.
- Richards K 2011, Children’s exposure to domestic violence in Australia, Trends and issues in crime and criminal justice, No 419, Australian Institute of Criminology, p.1.
- QLD Department of Child Safety 2018, Domestic and family violence and its relationship to child protection – practice paper, QLD Government, p. 12-13.
- Inamendments made to the Restraining Orders Act 1997 (ROA) on 1 July 2017, the terminology used by the WA Police Force is ‘family violence’. The term domestic violence is no longer used within the policing context.
- Australian Institute of Health and Welfare 2019, Family, domestic and sexual violence in Australia: continuing the national story 2019, Cat no FDV 3, AIHW, p. 71.
- Crime incidents of family and domestic violence are considered to be incidents that include a valid offence.
- Australian Bureau of Statistics (ABS) 2013, Defining the Data Challenge for Family, Domestic and Sexual Violence, ABS.
- Australian Bureau of Statistics (ABS) 2019, 4906.0 - Personal Safety, Australia, 2016, ABS.
- Ibid.
- Australian Bureau of Statistics (ABS) 2019, 4906.0 - Personal Safety, Australia, 2016, Table 43.3 Experience of either physical or sexual abuse before the age of 15(a), ABS.
- Australian Bureau of Statistics (ABS) 2016, Media Release: Childhood abuse increases risk of violence in adulthood, ABS.
- Australian Bureau of Statistics (ABS) 2019, 4510.0 - Recorded Crime - Victims, Australia, 2018 Explanatory Notes, ABS.
- Australian Law Reform Commission 2010, The prevalence of sexual violence, Australian Government [website].
- WA Department for Child Protection and Family Support (now Communities) 2014, Policy on child sexual abuse, WA Government.
- Although there is no data explicitly reporting on intimate partner violence experienced by young people aged 15 to 19 years. Data from the Australian Institute of Health and Welfare 2019, Family, domestic and sexual violence in Australia: continuing the national story 2019 reports that young women aged 15 to 24 years are significantly more likely to be hospitalised for family violence-related assaults than young men (Figure 3.7: Rate of hospitalisations for family or domestic violence assaults, by relationship to perpetrator, by age, by sex, 2016–17 (rate per 100,000)). Further, the ABS, Personal Safety Survey reports that women are three times more likely to have experienced violence by an intimate partner since the age of 15 year than men.
- Australian Bureau of Statistics (ABS) 2019, 4906.0 - Personal Safety, Australia, 2016, Table 31.3 Experience of Abuse before the age of 15, Characteristics of abuse by sex of respondent, Proportion of persons, ABS.
- Ibid.
- Campo M and Tayton S 2015, Domestic and family violence in regional, rural and remote communities: An overview of key issues, Child Family Community Australia, Australian Institute of Family Studies.
- Mishra G et al 2014, Health and wellbeing of women aged 18 to 23 in 2013 and 1996: Findings from the Australian Longitudinal Study on Women’s Health, Report prepared for the Australian Government, Department of Health.
- Australian Institute of Health and Welfare (AIHW) 2019, Family, domestic and sexual violence in Australia: continuing the national story 2019, Cat no FDV 3, AIHW, p. 101.
- Campo M and Tayton S 2015, Domestic and family violence in regional, rural and remote communities: An overview of key issues, Child Family Community Australia, Australian Institute of Family Studies.
- Australian Institute of Health and Welfare (AIHW) 2018, Family, domestic and sexual violence in Australia 2018, Cat No FDV 2, AIHW, p. 85.
- Campo M and Tayton S 2015, Domestic and family violence in regional, rural and remote communities: An overview of key issues, Child Family Community Australia, Australian Institute of Family Studies.
- Australian Institute of Health and Welfare (AIHW) 2018, Family, domestic and sexual violence in Australia 2018, Cat no FDV 2, AIHW, p. 88.
- Australian Bureau of Statistics (ABS) 2019, 4510.0 - Recorded Crime - Victims, Australia, 2018 Explanatory Notes, ABS.
- Australian Bureau of Statistics (ABS) 2016, 4714.0 - National Aboriginal and Torres Strait Islander Social Survey, 2014-15, ABS.
- Bennetts Kneebone L 2015, Partner violence in the Longitudinal Study of Indigenous Children (LSIC), Research summary: No.3/2015, Department of Social Services, p. 9.
- Campo M 2015, Children's exposure to domestic and family violence: Key issues and responses, Australian Institute of Family Studies.
- El Murr A 2018, Intimate partner violence in Australian refugee communities, Child Family Community Australia, Australian Institute of Family Studies.
- Queensland Department of Child Safety, Youth and Women 2018, Domestic and family violence and its relationship to child protection: a practice paper, QLD Government, p. 19.
- InTouch Multicultural Centre Against Family Violence 2015, Submission to the Royal Commission into Family Violence, InTouch Multicultural Centre Against Family Violence.
- Australian Bureau of Statistics (ABS) 2020, Victims of FDV related offences, Table 25 Victims of Family and Domestic violence-related homicide, Selected characteristics, Selected states and territories, 2014-2019.
- The WA Ombudsman Child Death Review considers reportable deaths of WA children and young people aged 0 to 17 years. Investigable deaths are defined in the Ombudsman’s legislation, the Parliamentary Commissioner Act 1971 (see Section 19A(3)).
- WA Ombudsman 2019, Annual Report 2018-19: Child Death Review, WA Government, p. 66.
- Brown T et al 2019, Trends & issues in crime and criminal justice – Filicide Offenders, Australian Institute of Criminology.
Last updated August 2020
Although the majority of WA children and young people are living in a safe and supportive home environment, some are unable to live with their families for a range of reasons including abuse or neglect.1
The child protection system provides assistance to vulnerable children and young people who are suspected of being abused, harmed or neglected.2 In WA, the Department of Communities is responsible for child protection and investigates, responds to and manages child protection cases.
Forms of child abuse and neglect are generally categorised as physical abuse, sexual abuse, emotional abuse and neglect.3 Emotional abuse includes witnessing incidents of family and domestic violence when it is determined by the Department of Communities that the child or young person is at risk of significant harm.4 For information on family and domestic violence refer to the measure: Experiencing family and domestic violence.
This measure reports on data on WA children and young people involved in the child protection system. Most of the available data provides information about the number of children and young people involved in child protection and the provision of child protection services.
There is very limited data on the health and wellbeing outcomes of young people who have contact with the WA child protection system despite them being a particularly vulnerable group.
Abuse and neglect can have a profound impact on children and young people both in the short term and into adulthood including poor physical health, learning and developmental problems, substance abuse, mental illness, unlawful behaviour, homelessness and suicide.5
Recent research using linked data from WA has found that compared to children who have never had contact with the child protection system, children and young people who have left care are nearly twice as likely to be admitted to hospital, are three times more likely to have mental health related issues, are less likely to complete high school and more likely to have contact with the juvenile justice system.6
Child protection data only include those cases of abuse and neglect that were detected and reported.
However, child abuse and neglect often remain undetected for a variety of reasons including the private nature of the crime, the challenges children and young people experience about whether to make disclosures and whether they will be believed if they choose to disclose, and the difficulty of gathering evidence to substantiate allegations.7 The data below is therefore likely to be an underestimation of the number of children and young people being abused or neglected in WA.8
The Australian Institute of Health and Welfare (AIHW) publishes the Child Protection Australia report on an annual basis. This report compiles data from state and territory child protection agencies.9
Children and young people receiving child protection services include those who are: subject of an investigation of a notification; on a care and protection order; or living in care.10
In 2018–19, all Australian states and territories adopted a national definition of out-of-home care which resulted in changes to the measurement in some jurisdictions. WA was already reporting data in a manner consistent with the new definition, therefore these changes have no impact on the WA data. However, data from some other jurisdictions may not match data previously published and should not be compared with data prior to 2018–19.11 Where relevant this will be noted in the tables and graphs below.
Most data on children and young people in the child protection system is not disaggregated by age groups. Therefore, the analysis in this section is generally not specific to young people aged 12 to 17 years.
Children and young people in the child protection system
At 30 June 2019, the Department of Communities reported 5,379 children and young people in care in WA.12 Of these, 1,664 were 10 to 14 years of age and 756 were 15 years and older.
|
30 June 2017 |
30 June 2018 |
30 June 2019 |
|
|
Less than 1 year |
153 |
195 |
205 |
|
1 to 4 years |
1,038 |
1,034 |
1,136 |
|
5 to 9 years |
1,552 |
1,560 |
1,618 |
|
10 to 14 years |
1,432 |
1,548 |
1,664 |
|
15 years and older* |
620 |
692 |
756 |
|
Total |
4,795 |
5,029 |
5,379 |
Source: WA Department of Communities, Annual Reports
* Includes a small number of young people who are 18 years and older and are still under the care of the WA Government.
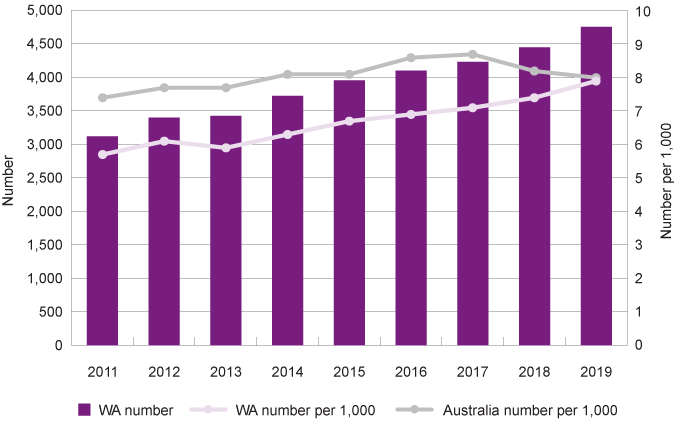
The rate of children and young people aged 0 to 17 years being in care in WA (at 30 June) has increased from 5.7 per 1,000 children and young people in 2011 to 7.9 per 1,000 in 2019.
|
WA |
Australia |
|||
|
Number |
Rate |
Number |
Rate |
|
|
2011 |
3,120 |
5.7 |
37,648 |
7.4 |
|
2012 |
3,400 |
6.1 |
39,621 |
7.7 |
|
2013 |
3,425 |
5.9 |
40,549 |
7.7 |
|
2014 |
3,723 |
6.3 |
43,009 |
8.1 |
|
2015 |
3,954 |
6.7 |
43,399 |
8.1 |
|
2016 |
4,100 |
6.9 |
46,448 |
8.6 |
|
2017 |
4,232 |
7.1 |
47,915 |
8.7 |
|
2018 |
4,448 |
7.4 |
45,756 |
8.2 |
|
2019 |
4,754 |
7.9 |
44,906** |
8.0** |
Source: AIHW, Child Protection Report 2018–19, Table 5.2: Children in out-of-home care, by state or territory, 30 June 2019 (and previous year’s reports)
* The AIHW reported number of children in care differs from the Department of Communities Annual Report as the Department of Communities includes unfunded living arrangements (including unendorsed arrangements). These are not included by AIHW to ensure national consistency. Refer AIHW, Child Protection Australia 2018–19 Appendixes B to G for further discussion of policy and practice differences that impact national comparability.
** The Australian total in 2018–19 is based on the new national definition of out-of-home care that excludes children on third-party parental responsibility orders. AIHW report that under the previous state-based definitions the 2018–19 total would have been 46,972 (an increase on the previous year).13
Children and young people aged 0 to 17 years in care, number and rate, WA and Australia, 30 June 2011 to 30 June 2019
Source: AIHW, Child Protection Report 2018–19, Table S5.5: Children in out-of-home care, by age group, Indigenous status and state or territory, 30 June 2019 (and previous year’s reports)
Notes:
1. The Australian rate in 2018–19 is based on the new national definition of out-of-home care that excludes children on third-party parental responsibility orders.14
2. The reduction in the number and rate of children in care across Australia in 2017–18 was principally due to a change in reporting practices in Victoria.15
The rate of WA children and young people being subject to substantiations,16 on care and protection orders17 and in care has steadily increased in WA over the last five years, while the rate of investigations18 was decreasing until 2018–19 when it increased substantially (from 17.4 per 1,000 to 20.7 per 1,000 children and young people). In 2018–19, there was an overall increase in the rate of children and young people receiving all types of child protection services.
|
Subject |
Subject of substantiations |
On care and |
In care* |
Total receiving |
|
|
2014–15 |
20.0 |
5.7 |
8.1 |
6.7 |
27.0 |
|
2015–16 |
18.4 |
7.1 |
8.3 |
6.9 |
25.8 |
|
2016–17 |
18.2 |
7.8 |
8.7 |
7.1 |
25.9 |
|
2017–18 |
17.4 |
7.6 |
9.3 |
7.4 |
25.1 |
|
2018–19 |
20.7 |
7.9 |
9.7 |
7.9 |
29.2 |
Source: AIHW, Child Protection Report 2018–19 Table A1: Children in the child protection system, by state or territory, 2014–15 to 2018–19 and Table 2.2 Children receiving child protection services, by state or territory, 2018–19 (and previous years equivalents)
* Children on care and protection orders and in care were measured as at 30 June each year. The remainder are during the year.
Notes:
1. Children might be involved in more than one component of the child protection system. As such, the components do not sum to the total children receiving child protection service.
2. WA out-of-home care data exclude children on third-party parental responsibility orders and from 2015–16 includes children placed in boarding schools.
3. Total receiving child protection services includes children who are subject of a notification under investigation.
Children and young people aged 0 to 17 years in the child protection system, number per 1,000, WA, 2014–15 to 2018–19
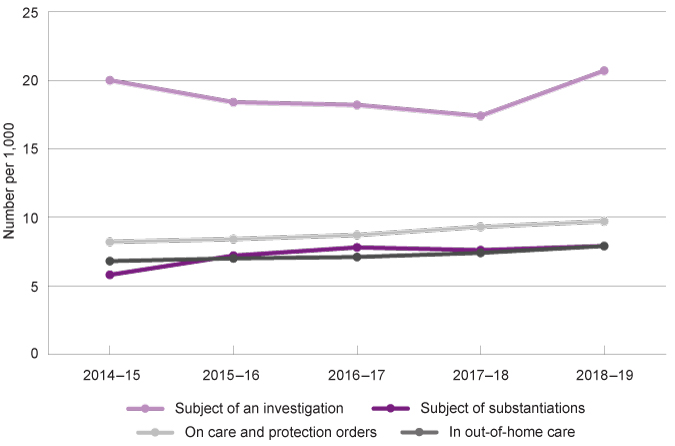
Source: AIHW Child Protection Report 2018–19 Table A1: Children in the child protection system, by state or territory, 2014–15 to 2018–19 and Table 2.2 Children receiving child protection services, by state or territory, 2018–19 (and previous years equivalents)
The significant increase in 2018–19 in the number of children and young people subject to investigations per 1,000 children and young people is related to an increase in the number of notifications received from 18,168 in 2017–18 to 20,700 and a corresponding increase in the number of investigations of notifications from 12,154 in 2017–18 to 14,200 in 2018–19.19
Aboriginal children and young people
WA Aboriginal children and young people are significantly overrepresented in the child protection system in comparison to non-Aboriginal children and young people.
At 30 June 2019, the rate of WA Aboriginal children and young people in out-of-home care was 64.1 per 1,000 children, 17 times the rate for WA non-Aboriginal children and young people (3.8 per 1,000).
|
Aboriginal |
Non-Aboriginal |
Total |
||||
|
Number |
Rate |
Number |
Rate |
Number |
Rate |
|
|
2015 |
2,062 |
55.3 |
1,890 |
3.4 |
3,954 |
6.7 |
|
2016 |
2,212 |
58.9 |
1,887 |
3.4 |
4,100 |
6.9 |
|
2017 |
2,321 |
61.4 |
1,911 |
3.4 |
4,232 |
7.1 |
|
2018 |
2,452 |
64.4 |
1,994 |
3.6 |
4,448 |
7.4 |
|
2019 |
2,604 |
64.1 |
2,148 |
3.8 |
4,754 |
7.9 |
Source: AIHW, Child protection Australia: 2018–19, Table S5.10: Children in out-of-home care, by Indigenous status and state or territory, 30 June 2019, AIHW and previous years' tables
The rate of Aboriginal children and young people being in care across WA increased substantially from 2011 to 2018, but decreased marginally in 2019.
Children and young people aged 0 to 17 years in care by Aboriginal status, number per 1,000, WA, 30 June 2015 to 2019
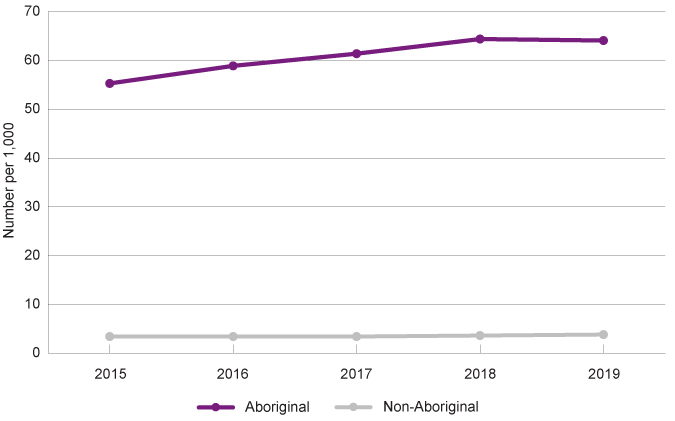
Source: AIHW, Child protection Australia: 2018–19, Table S5.10: Children in out-of-home care, by Indigenous status and state or territory, 30 June 2019, AIHW and previous years' tables
The overrepresentation of Aboriginal children and young people in the child protection system is influenced by persistent social disadvantage which began with the process of colonisation including policies of wage-theft, assimilation and forced child removals and has continued with ongoing discrimination, poverty and inter-generational trauma.20,21
There is also recognition that child protection systems around Australia may themselves contribute to the overrepresentation of Aboriginal children and young people for various reasons. These include that when children are removed from their remote communities it is difficult to move toward family re-unification, western cultural bias regarding appropriate family practices, primary caregivers who are not biological parents being excluded from child protection proceedings, services provided not being culturally safe and child protection workers without the cultural knowledge to effectively support Aboriginal families.22,23,24,25
Children and young people living in remote and very remote locations in WA are three to four times more likely to be involved in the child protection system than those living in metropolitan areas. In WA, Aboriginal children and young people are more likely to live in remote and regional areas.
|
VIC |
QLD |
WA |
SA |
TAS |
ACT |
NT |
Australia |
|
|
Major cities |
11.8 |
3.8 |
6.2 |
3.5 |
N/A |
2.6 |
N/A |
7.4 |
|
Inner regional |
18.3 |
5.6 |
6.7 |
6.4 |
4.4 |
16.0 |
- |
10.6 |
|
Outer regional |
21.2 |
8.0 |
9.7 |
8.1 |
5.7 |
N/A |
10.0 |
10.1 |
|
Remote |
15.3 |
11.7 |
17.6 |
5.4 |
5.4 |
N/A |
30.9 |
16.2 |
|
Very remote |
N/A |
10.0 |
23.1 |
27.7 |
6.3 |
N/A |
26.8 |
20.1 |
|
Total |
13.4 |
4.9 |
7.4 |
4.6 |
4.8 |
2.6 |
18.3 |
8.6 |
Source: AIHW, Child Protection Report 2018–19, Table S3.7b: Children who were the subject of substantiations, by remoteness area and state or territory, 2018–19
N/A – the remoteness area classification is not valid for this jurisdiction.
Note: New South Wales did not provide data in 2018–19.
Children and young people aged 0 to 17 years who were the subject of substantiations by remoteness area, number per 1,000, WA, 2018–19
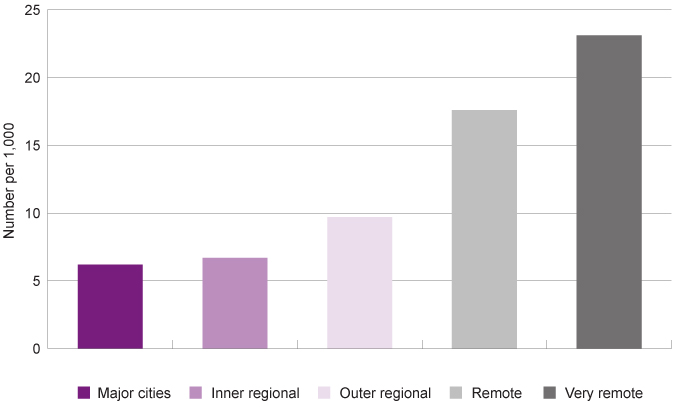
Source: AIHW, Child Protection Report 2018–19, Table S3.7b: Children who were the subject of substantiations, by remoteness area and state or territory, 2018–19
The WA Department of Communities Child Protection Activity Performance Information report provides further information on the children and young people in care in WA.
|
Aboriginal |
Non-Aboriginal |
Total |
||||
|
District |
Number |
Per cent in district |
Number |
Per cent in district |
Number |
Per cent of total |
|
Metropolitan area |
||||||
|
Perth |
131 |
45.5 |
157 |
54.5 |
288 |
5.4 |
|
Armadale |
316 |
54.3 |
266 |
45.7 |
582 |
10.8 |
|
Cannington |
249 |
56.1 |
195 |
43.9 |
444 |
8.3 |
|
Fremantle |
180 |
53.3 |
158 |
46.7 |
338 |
6.3 |
|
Joondalup |
121 |
34.2 |
233 |
65.8 |
354 |
6.6 |
|
Midland |
239 |
49.7 |
242 |
50.3 |
481 |
8.9 |
|
Rockingham |
108 |
29.8 |
255 |
70.2 |
363 |
6.7 |
|
Mirrabooka |
171 |
48.9 |
179 |
51.1 |
350 |
6.5 |
|
Fostering/Adoption |
0 |
0.0 |
11 |
100.0 |
11 |
0.2 |
|
Regional and remote |
||||||
|
Goldfields |
121 |
79.1 |
32 |
20.9 |
153 |
2.8 |
|
Great Southern |
107 |
54.6 |
89 |
45.4 |
196 |
3.6 |
|
Mid West |
210 |
85.0 |
37 |
15.0 |
247 |
4.6 |
|
Peel |
94 |
29.0 |
230 |
71.0 |
324 |
6.0 |
|
Pilbara |
199 |
93.4 |
14 |
6.6 |
213 |
4.0 |
|
South West |
152 |
40.0 |
228 |
60.0 |
380 |
7.1 |
|
West Kimberley |
206 |
99.0 |
2 |
1.0 |
208 |
3.9 |
|
East Kimberley |
159 |
100.0 |
0 |
0.0 |
159 |
3.0 |
|
Wheatbelt |
179 |
62.2 |
109 |
37.8 |
288 |
5.4 |
|
Total |
2,942 |
54.7 |
2,437 |
45.3 |
5,379* |
100.0 |
Source: Department of Communities, Activity Performance Information: 2018–19, Children and young people in care at 30 June 2019, by district
* The Department of Communities number of children in care at 30 June differs from the AIHW Child Protection report as it includes unfunded living arrangements (including unendorsed arrangements). These are not included by AIHW to ensure national consistency.
Note: The district is generally where the family of the child resides at the time of the notification, however, if a child is in care for a long period of time the district could be changed to where the child now resides.
In the Perth metropolitan area, a high proportion of children and young people in care were from Armadale (10.8% or 582), Midland (8.9% or 481) and Cannington (8.3% or 444). In certain regional and remote districts, the number of Aboriginal children and young people in care compared to non-Aboriginal children was very high, in particular East Kimberley (100.0%), West Kimberley (99.0%), Pilbara (93.4%), Mid West (85.0%) and the Goldfields (79.1%).
It should be noted that this data does not take into account the number of children and young people living in each district.
This data highlights particular districts in WA where families and communities may require more accessible, relevant and culturally appropriate services and resources to assist them to provide a safe home for their children.
The high number of substantiated child abuse and neglect cases in regional and remote areas of WA is consistent with the greater prevalence of socioeconomic disadvantage in these regions, including homelessness and overcrowding, higher unemployment, and less access to services. In research into social exclusion in Australia, the National Centre for Social and Economic Modelling (NATSEM) determined that 36.0 per cent of Australian children in remote and very remote areas were facing the highest risk of social exclusion.26
For more information on social exclusion refer to the Material basics indicator.
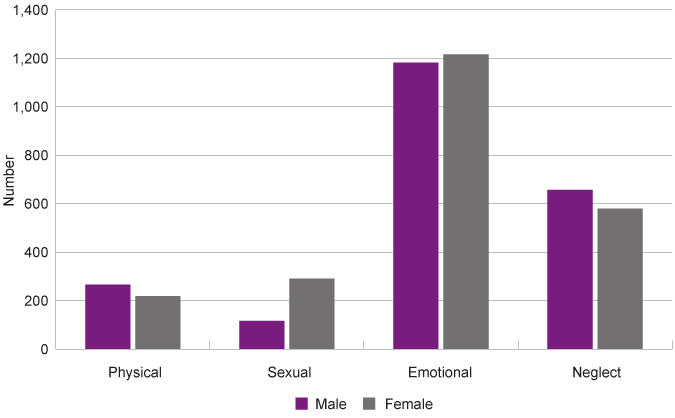
Type of abuse
In 2018–19, emotional abuse was the most common primary type27 of abuse or neglect substantiated for WA children and young people (53.2%), followed by neglect (26.9%), physical abuse (10.7%), and sexual abuse (8.7%).28
In 2015–16 the definition of emotional abuse in WA was broadened to include children witnessing family and domestic violence. Since that time the number of children subject to substantiations related to emotional abuse have increased considerably (from 1,558 in 2015–16 to 2,508 in 2018–19).
Over the same period, the number of children with substantiations where the primary type of abuse was physical or sexual abuse has decreased. Substantiations of neglect have remained relatively stable. Overall, although there have been shifts between categories, there has been a general increase in the number of children being subject to substantiations of abuse or neglect since 2015–16.
|
2015–16 |
2016–17 |
2017–18 |
2018–19 |
||
|
Number |
Per cent |
||||
|
Physical abuse |
750 |
620 |
540 |
503 |
10.7 |
|
Sexual abuse |
696 |
620 |
611 |
412 |
8.7 |
|
Emotional abuse |
1,558 |
2,059 |
2,242 |
2,508 |
53.2 |
|
Neglect |
1,168 |
1,299 |
1,107 |
1,271 |
26.9 |
|
Not stated |
26 |
35 |
30 |
23 |
0.5 |
|
Total |
4,198 |
4,633 |
4,530 |
4,717 |
100.0 |
Source: AIHW, Child Protection Report 2018–19, Table S3.10: Children who were the subject of a substantiation of a notification received during 2018–19, by type of abuse or neglect, Indigenous status and state or territory (and previous years equivalents)
Children and young people aged 0 to 17 years who were the subjects of substantiations of notifications by type of abuse or neglect, number, WA, 2015–16 to 2018–19
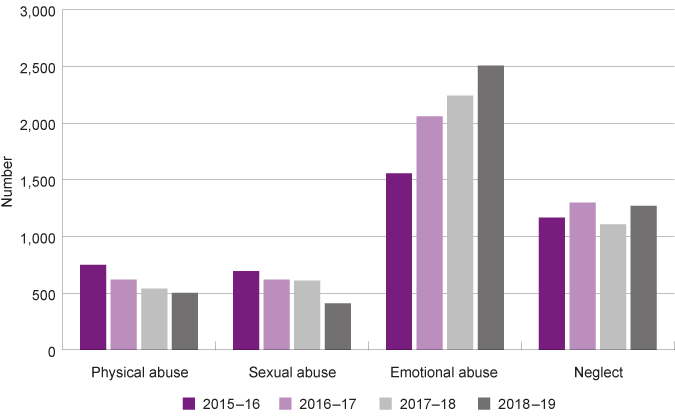
Source: AIHW, Child Protection Report 2018–19, Table S3.10: Children who were the subject of a substantiation of a notification received during 2018–19, by type of abuse or neglect, Indigenous status and state or territory (and previous years' equivalents)
The type of abuse or neglect experienced is generally similar for male and female children and young people, with the exception that female children and young people are more likely than male children and young people to be the subjects of substantiations of sexual abuse.
|
Male |
Female |
Total* |
||||
|
Number |
Per cent |
Number |
Per cent |
Number |
Per cent |
|
|
Physical |
266 |
11.9 |
218 |
9.4 |
503 |
10.7 |
|
Sexual |
116 |
5.2 |
290 |
12.5 |
412 |
8.7 |
|
Emotional** |
1,182 |
53.0 |
1,216 |
52.6 |
2,508 |
53.2 |
|
Neglect |
657 |
29.4 |
579 |
25.1 |
1,271 |
26.9 |
|
Not stated |
11 |
0.5 |
8 |
0.3 |
23 |
0.5 |
|
Total |
2,232 |
100.0 |
2,311 |
100.0 |
4,717 |
100.0 |
Source: AIHW, Child Protection Report 2018–19, Table S3.5: Children who were the subjects of substantiations of notifications received during 2018–19 by type of abuse or neglect, sex and state or territory
* Includes gender not stated.
** Emotional abuse includes children and young people witnessing family and domestic violence.
Children and young people aged 0 to 17 years who were the subjects of substantiations of notifications by type of abuse or neglect and gender, number, WA, 2018–19
Source: AIHW, Child Protection Report 2018–19, Table S3.5: Children who were the subjects of substantiations of notifications received during 2018–19 by type of abuse or neglect, sex and state or territory
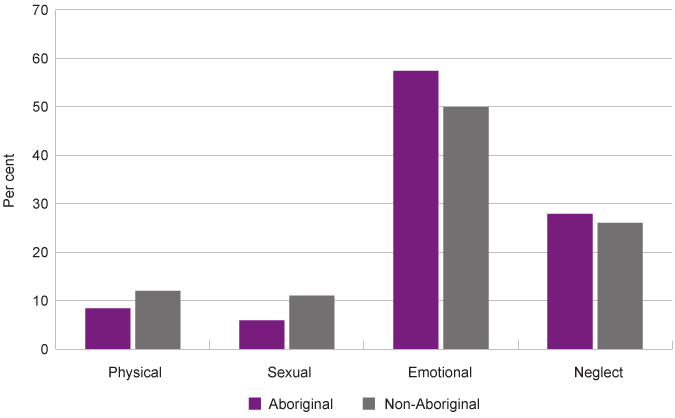
Emotional abuse (including family and domestic violence) was the most common type of substantiated abuse for both Aboriginal and non-Aboriginal children and young people (Aboriginal: 57.4%, non-Aboriginal: 49.8%).
A lower proportion of Aboriginal than non-Aboriginal children and young people were subjects of substantiations of physical and sexual abuse (physical: 8.4% compared to 12.5%, sexual: 5.9% compared to 11.0%).
|
Aboriginal |
Non-Aboriginal |
Total |
||||
|
Number |
Per cent |
Number |
Per cent |
Number |
Per cent |
|
|
Physical |
178 |
8.4 |
325 |
12.5 |
503 |
10.7 |
|
Sexual |
125 |
5.9 |
287 |
11.0 |
412 |
8.7 |
|
Emotional* |
1,211 |
57.4 |
1,297 |
49.8 |
2,508 |
53.2 |
|
Neglect |
590 |
27.9 |
681 |
26.1 |
1,271 |
26.9 |
|
Not stated |
17 |
0.3 |
16 |
0.6 |
23 |
0.5 |
|
Total |
2,111 |
100.0 |
2,606 |
100.0 |
4,717 |
100.0 |
Source: AIHW, Child Protection Report 2018–19, Table S3.10: Children who were the subject of a substantiation of a notification received during 2018–19, by type of abuse or neglect, Indigenous status and state or territory
* Emotional abuse includes children and young people witnessing family and domestic violence.
Children and young people aged 0 to 17 years who were subjects of substantiations of notifications by Aboriginal status and type of abuse or neglect, per cent, WA, 2018–19
Source: AIHW, Child Protection Report 2018–19,Table S3.10: Children who were the subject of a substantiation of a notification received during 2018–19, by type of abuse or neglect, Indigenous status and state or territory
A high proportion (26.9%) of WA children and young people who have had contact with the child protection system was as a result of neglect.
Neglect is a failure to provide minimally acceptable care.29 Research has highlighted strong and consistent relationships between child abuse and neglect and economic disadvantage.30 Neglect is closely associated with families experiencing poverty and social exclusion, although not all carers in poverty are neglectful and not all children who are neglected come from financially disadvantaged families.31
Across Australia, children and young people who are living in the lowest socioeconomic areas are more likely to be subject to a child protection substantiation than children living in other more advantaged areas (34.7% were in the areas with the lowest socioeconomic status compared to 6.3% in the highest).
|
Aboriginal |
Non-Aboriginal |
Total |
|
|
1 - Lowest |
41.8 |
31.6 |
34.7 |
|
2 |
28.4 |
23.0 |
24.3 |
|
3 |
14.7 |
23.8 |
21.3 |
|
4 |
11.4 |
14.3 |
13.4 |
|
5 - Highest |
3.6 |
7.2 |
6.3 |
Source: AIHW, Child Protection Report 2018–19,Table S3.8: Children who were the subjects of substantiations, by socioeconomic area and Indigenous status, 2018–19
In 2018–19, 41.8 per cent of Aboriginal children and young people who were subject to substantiations were living in the lowest socioeconomic areas of Australia (compared to 31.6% of non-Aboriginal children and young people).
A significantly higher proportion of Aboriginal families experience social and financial disadvantage, compared to non-Aboriginal families.32
Research using data from the 2016 Census concluded that in 2016, 31.4 per cent of Aboriginal Australians were living in poverty (50.0% median income before housing costs).33
Age of children and young people in the child protection system
In 2018–19, almost 10,000 (9,988) WA children and young people aged between five and 14 years (and their families) were receiving child protection services.
Aboriginal children and young people are overrepresented in the child protection system across all age groups.
|
Aboriginal |
Non-Aboriginal |
Total* |
||||
|
Number |
Rate |
Number |
Rate |
Number |
Rate |
|
|
Unborn |
339 |
N/A |
233 |
N/A |
671 |
N/A |
|
<1 years |
528 |
223.5 |
570 |
18.7 |
1,160 |
35.3 |
|
1 to 4 years |
1,717 |
187.0 |
2,033 |
15.6 |
3,947 |
28.4 |
|
5 to 9 years |
2,163 |
188.8 |
2,773 |
17.2 |
5,124 |
29.7 |
|
10 to 14 years |
1,981 |
177.0 |
2,750 |
18.0 |
4,864 |
29.6 |
|
15 to 17 years |
677 |
108.0 |
992 |
11.7 |
1,715 |
18.9 |
|
Total |
7,405 |
183.0 |
9,351 |
16.7 |
17,481 |
29.2 |
Source: AIHW, Child Protection Report 2018–19, Table S2.3 Children receiving child protection services, by age group, Indigenous status and state or territory, 2018–19
* Includes unknown Aboriginal status
N/A: Unborn children are covered under WA child protection legislation and are therefore included in the ‘All children’ rates. However, they are excluded in rate calculations for the ‘less than 1’ and ‘0–17’ categories. Source: Australian Institute of Health and Welfare (AIHW) 2020, Child Protection Report 2018-19 Child welfare series No 72, Cat no CWS 74, AIHW, p. 24.
The high rates of involvement in child protection services for infants and unborn children is discussed in the Safe in the home indicator for the 0 to 5 years age group.
Data on substantiations by age group highlights that infants and younger children are more likely to be subject to substantiations than young people over 15 years of age, with 15 to 17 year-old young people in WA significantly less likely to be subjects of substantiations with a rate of 3.2 per 1,000 in 2017–18.
|
2014–15 |
2015–16 |
2016–17 |
2017–18 |
2018–19 |
|
|
<1 years |
7.6 |
9.8 |
12.0 |
11.8 |
13.0 |
|
1–4 years |
5.6 |
7.2 |
8.4 |
8.1 |
8.8 |
|
5–9 years |
6.6 |
7.5 |
8.2 |
7.7 |
8.0 |
|
10–14 years |
5.7 |
6.8 |
7.4 |
7.1 |
6.8 |
|
15–17 years |
2.4 |
3.7 |
3.2 |
3.1 |
3.5 |
|
0–17 years |
5.5 |
6.8 |
7.5 |
7.2 |
7.5 |
|
Total |
5.7 |
7.1 |
7.8 |
7.6 |
7.9 |
|
Children and young people |
3,382 |
4,198 |
4,633 |
4,530 |
4,717 |
Source: AIHW, Child Protection Report 2018–19 Table 3.3: Children who were the subjects of substantiations of notifications, by age group and state or territory, 2018–19 (rate) (and previous years’ reports)
Note: Unborn children are covered under WA child protection legislation and are therefore included in the ‘All children’ rates. However, they are excluded in rate calculations for the ‘less than 1’ and ‘0–17’ categories.
The higher rates of substantiation for infants is discussed in the Safe in the home indicator for the 0 to 5 years age group.
For children and young people aged 10 to 14 years there has been a reduction in the rate of substantiations in the last two years, while for young people aged 15 to 17 years the rate of substantiations has remained relatively stable.
Children and young people who were subjects of substantiations of notifications, by age group, number per 1,000, WA, 2014–15 to 2018–19
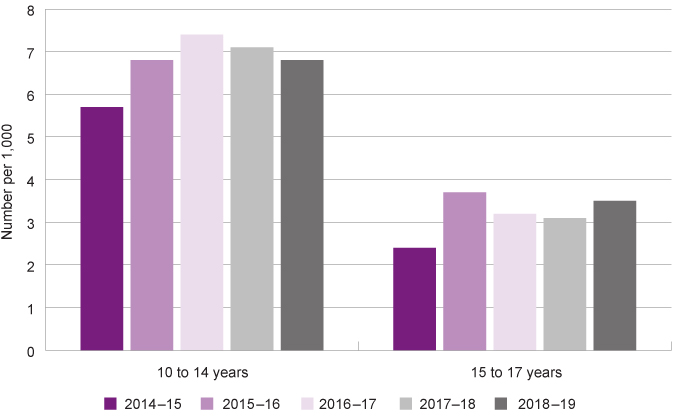
Source: AIHW, Child Protection Report 2018–19 Table 3.3: Children who were the subjects of substantiations of notifications, by age group and state or territory, 2018–19 (rate) (and previous years’ reports)
Young people aged 15 to 17 years are less likely to be in the child protection system than other age groups. Research suggests that young people aged 15 to 17 years are under-represented in the child protection system.34 While young children may express fear and anxiety in response to trauma, adolescents are more likely to be aggressive, run away from home, and engage in risky behaviours. These behaviours can result in these young people becoming homeless and/or coming into contact with the youth justice system instead of the child protection system.35,36
For more information on young people experiencing homelessness refer to the Material basics indicator.
Young people with a history of abuse and neglect are highly vulnerable to coming into contact with the youth justice system. Those who do, often have a range of complex needs, including developmental trauma and problem behaviours.37
The Australian Institute of Health and Welfare (AIHW) used linked data from child protection and youth justice supervision data collections to report that young people who had received child protection services were nine times more likely than the general population to have also been under youth justice supervision.38 Young people who had been in care were 16 times more likely than the general population to have been under youth justice supervision.39 These findings very clearly show that the current system is not delivering positive outcomes for many of these young people.
For more information on young people in the youth justice system refer to the Contact with the youth justice system indicator.
Young people leaving care
In WA, once young people turn 18 years of age they are no longer under the care of the CEO (WA Department of Communities), however, they are provided with support until they are 25 years of age.40 In 2018–19, 195 young people aged 18 years or older exited the WA child protection system.41
Research shows that young people who leave care experience significant social and economic disadvantage including a high risk of homelessness, mental illness, unemployment and substance abuse issues.42 Young people who leave care are also more likely to have involvement in the youth justice system.43
The Department of Communities is required to help a young person who is about to leave care to prepare for this and provide support including to find accommodation, enrol in education and training, find employment, access legal advice and health and counselling services.44
In 2018 the WA Auditor General concluded that about 65.0 per cent of young people who were eligible for support did not get it early enough, or at all. This put them at a high risk of being homeless, unemployed, missing out on education and not getting the health and other services they may need.45
The WA Department of Communities has committed to a trial in the south metropolitan region partnering with Anglicare WA to enhance support for young people leaving care aged 18 to 21 years.46
Type of placement and placement stability
Most (87.0%) WA children and young people in care are in home-based care with either foster parents or a family member.
|
Aboriginal |
Non-Aboriginal |
Total |
||||
|
Number |
Per cent |
Number |
Per cent |
Number |
Per cent |
|
|
Foster care with |
1,366 |
46.4 |
1,074 |
44.1 |
2,440 |
45.4 |
|
General foster care |
1,016 |
34.5 |
930 |
38.2 |
1,946 |
36.2 |
|
Parent/former guardian |
170 |
5.8 |
122 |
5.0 |
292 |
5.4 |
|
Residential care |
185 |
6.3 |
194 |
8.0 |
379 |
7.0 |
|
Unendorsed arrangement |
173 |
5.9 |
82 |
3.4 |
255 |
4.7 |
|
Other |
32 |
1.1 |
35 |
1.4 |
67 |
1.2 |
|
Total |
2,942 |
100.0 |
2,437 |
100.0 |
5,379 |
100.0 |
Source: Compiled from the Department of Communities, Activity Performance Information: 2018–19, Children and young people in care at 30 June 2019, by living arrangement
Only a small number of children in care (379 representing 7.0%) are in residential care or family group homes. Residential care is placement in a residential building where the purpose is to provide placements for children and where there are paid staff.47 The children and young people placed in residential care generally have more complex needs.48
Unendorsed arrangements are where a young person self-selects to live with a person or people who have not been assessed or approved by the Department of Communities. In this instance, the Department of Communities is required to arrange an assessment of the placement as a matter of urgency.49
It is important to note that Aboriginal children and young people are significantly over-represented in this category (67.8% of unendorsed arrangements are for Aboriginal children and young people).
Stable care placements tend to deliver better learning and psycho-social outcomes for affected children than experiences of ongoing episodes of instability.50 Placement instability can have significant adverse effects on young people including attachment issues and a lack of safe and supportive relationships, which can lead to poor educational, socio-emotional and behavioural outcomes.51
Most (2,277) WA children and young people in care for more than two years have one placement, however 362 children and young people (11.7%) have had three or more placements.
|
Aboriginal |
Non-Aboriginal |
Total |
||||
|
Number |
Per cent |
Number |
Per cent |
Number |
Per cent |
|
|
1 |
1,280 |
72.9 |
997 |
73.6 |
2,277 |
73.2 |
|
2 |
255 |
14.5 |
216 |
15.9 |
471 |
15.1 |
|
3-4 |
163 |
9.3 |
110 |
8.1 |
273 |
8.8 |
|
5+ |
57 |
3.2 |
32 |
2.4 |
89 |
2.9 |
|
Total |
1,755 |
100.0 |
1,355 |
100.0 |
3,110 |
100.00 |
Source: AIHW, Child Protection Report 2018–19, Table S6.12: Children in out-of-home care for 2 or more years at 30 June 2019, by state or territory, Indigenous status, age and number of placements (Indicator 1.7b)
For more information on the placement of Aboriginal young people in care refer to the next measure: Aboriginal and Torres Strait Islander Child Placement Principle.
According to the experiences of children and young people who participated in the CREATE Foundation’s 2017–18 Out-of-home care in Australia: Children and young people’s views after five years of National Standards survey, kinship care provided the least disrupted living arrangement, with the lowest average number of placements.52 Results are not reported for participating WA children and young people.
Expenditure per child
The 2020 Productivity Commission Report on Government Services shows that in 2018–19 compared to other Australian jurisdictions the WA Government spent the second lowest amount (per child in the population) on child protection, intensive family support services and family support services.53
There has also been minimal increase in WA spending across these services over the last four years, in contrast to most other Australian jurisdictions.
|
2014–15 |
2015–16 |
2016–17 |
2017–18 |
2018–19 |
|
|
NSW |
965.5 |
1,057.7 |
1,106.7 |
1,184.9 |
1,296.8 |
|
VIC |
688.4 |
748.1 |
825.3 |
945.4 |
1,067.4 |
|
QLD |
811.4 |
822.3 |
864.2 |
940.8 |
1,015.8 |
|
WA |
816.0 |
820.2 |
828.7 |
846.6 |
878.1 |
|
SA |
850.9 |
1,116.7 |
1,442.0 |
1,496.8 |
1,493.4 |
|
TAS |
743.9 |
756.3 |
884.8 |
1,017.4 |
1,200.5 |
|
ACT |
629.5 |
671.2 |
725.6 |
712.8 |
734.5 |
|
NT |
3,015.4 |
3,087.7 |
3,351.1 |
3,457.4 |
3,386.1 |
|
Australia |
854.8 |
920.8 |
992.9 |
1,072.1 |
1,159.9 |
Source: Productivity Commission, Report on Government Services 2020 – Child protection services, Table 16.A7 State and Territory Government real recurrent expenditure on all child protection services (2018–19 dollars)
* Real expenditure includes Protective intervention services, out-of-home care, intensive family support services and family support services.
Notes:
1. Expenditure per child relates to children aged 0 to 17 years in the population.
2. Population data used to derive rates are from the 2016 Census preliminary estimates.
3. Refer to the Productivity Commission Report on Government Services for more information on comparatives and inclusions for each state and territory.
Real expenditure per child by category and jurisdiction, dollars per child, Australia excluding ACT and NT, 2014–15 to 2018–19
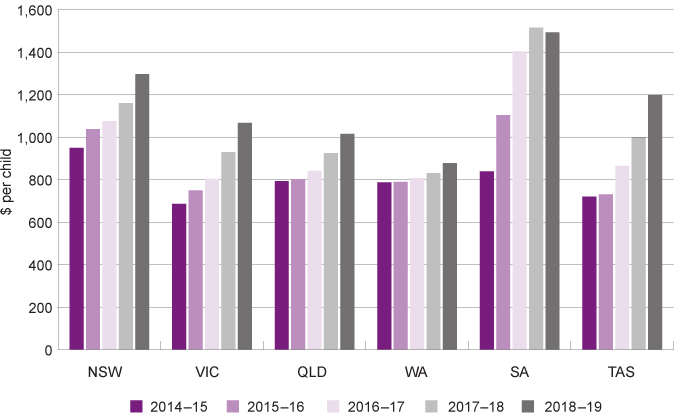
Source: Productivity Commission 2020, Report on Government Services 2020 – Child protection services, Table 16.A7 State and Territory Government real recurrent expenditure on all child protection services (2018–19 dollars)
* Real expenditure includes Protective intervention services, out-of-home care, intensive family support services and family support services.
Further analysis shows that WA has the lowest expenditure per child in the population on general family support services and intensive family support services of all states and territories with only 27.5 and 19.4 dollars per child respectively in 2018–19.
|
Family support services |
Intensive family support services |
Protective intervention services |
Out-of-home care services |
|
|
NSW |
70.6 |
103.7 |
360.8 |
761.8 |
|
VIC |
163.9 |
105.1 |
241.8 |
556.5 |
|
QLD |
72.0 |
91.2 |
260.1 |
592.4 |
|
WA |
27.5 |
19.4 |
332.4 |
498.7 |
|
SA |
87.1 |
42.3 |
159.7 |
1,204.4 |
|
TAS |
63.3 |
90.7 |
225.7 |
820.8 |
|
ACT |
32.9 |
55.4 |
159.9 |
486.3 |
|
NT |
751.8 |
87.9 |
396.1 |
2,150.3 |
|
Australia |
97.7 |
87.1 |
287.7 |
687.3 |
Source: Productivity Commission, Report on Government Services 2020 – Child protection services, Table 16.A7 State and Territory Government real recurrent expenditure on all child protection services (2018–19 dollars)
Note: Family support services are general services to families in need including general support, diversionary services and counselling. Intensive family support services are specialist services that aim to prevent the imminent separation of children from their primary caregivers as a result of child protection concerns and to reunify families where separation has already occurred. Protective intervention services functions of government that receive and assess allegations of child abuse, neglect and/harm to children and young people.
Real expenditure per child by category and jurisdiction, dollars per child, Australia excluding ACT and NT, 2018-19
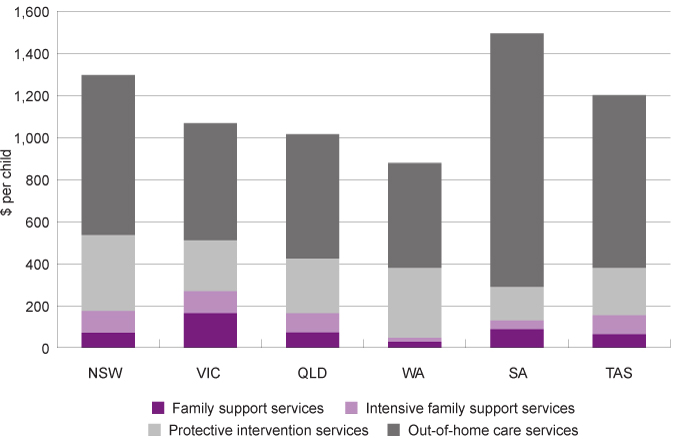
Source: Productivity Commission, Report on Government Services 2020 – Child protection services, Table 16.A7 State and Territory Government real recurrent expenditure on all child protection services (2018–19 dollars)
At the same time, in 2018–19 WA had the third highest expenditure per child in the population on protective intervention services (332.4 dollars per child).
Variations across jurisdictions can be due to different definitions and methodologies for calculating the total expenditure in each category. However, the results highlight that WA is spending a disproportionate amount on tertiary services in the child protection system with significantly less being spent on primary and secondary services (family support services and intensive family support services).
International and Australian research has shown that while tertiary services are critical, investing in services for disadvantaged children and young people (and communities) which are focused on early intervention and prevention result in better outcomes than spending on tertiary services (e.g. child protection or youth justice).54
Early intervention is essential to improve the lives of children and young people and to strengthen families and communities. Recent analysis has highlighted the significant cost to Australia due to late intervention. This analysis estimated that the total cost to government for children and young people experiencing serious issues is $15.2 billion every year. These costs include the costs of child protection, youth justice, mental health issues, youth unemployment and youth homelessness.55
Endnotes
- Mullan K and Higgins D 2014, A safe and supportive family environment for children: key components and links to child outcomes - Occasional Paper No 52, Department of Social Services, p. 1.
- Australian Institute of Health and Welfare (AIHW) 2019, Child Protection Overview, AIHW [website].
- Australian Institute of Health and Welfare (AIHW) 2020, Child protection Australia: 2018–19, Child welfare series No 72, Cat no CWS 74, AIHW.
- WA Department for Child Protection and Family Support (now Communities) 2014, Emotional abuse – Family and domestic violence policy, WA Government.
- Hunter C 2014, Effects of child abuse and neglect for children and adolescents, National child Protection Clearinghouse Resource Sheet, AIFS.
- Lima F et al 2018, Exploring outcomes for children who have experienced out-of-home care, Telethon Kids Institute.
- Child Family Community Australia 2017, Child Abuse and Neglect Statistics: CFCA Resource Sheet, Australian Institute of Family Studies.
- Ibid.
- Australian Institute of Health and Welfare (AIHW) 2020, Child protection Australia: 2018–19, Child welfare series No 72, Cat no CWS 74, AIHW.
- Australian Institute of Health and Welfare (AIHW) 2020, Child protection Australia: 2018–19, Child welfare series No 72, Cat no CWS 74, AIHW.
- Australian Institute of Health and Welfare (AIHW) 2020, Child protection Australia 2018–19 Appendixes B to G, AIHW, p. 1.
- Department of Communities 2019, Child Protection Activity Performance Report 2017–18, WA Government p. 17.
- Australian Institute of Health and Welfare (AIHW) 2020, Child protection Australia 2018–19 Appendixes B to G, AIHW, p. 1.
- Australian Institute of Health and Welfare (AIHW) 2020, Child protection Australia 2018–19 Appendixes B to G, AIHW, p. 1.
- Australian Institute of Health and Welfare (AIHW) 2020, Child protection Australia 2018–19 Appendixes B to G, AIHW, p. 1.
- A substantiation of a notification is the conclusion (following an investigation) that there was reasonable cause to believe that a child had been, was being, or was likely to be, abused, neglected or otherwise harmed. Source: Australian Institute of Health and Welfare (AIHW) 2019, National framework for protecting Australia's children indicators.
- Care and protection orders are legal orders or arrangements that give child protection department some responsibility for a child’s welfare. Source: Australian Institute of Health and Welfare (AIHW) 2019, Child Protection: Glossary.
- The WA Department of Communities does not use the terminology of ‘investigations’ and instead uses the term ‘Safety and wellbeing assessments’.
- Australian Institute of Health and Welfare (AIHW) 2020, Child protection Australia: 2018–19, Table S3.1: Notifications, by type of action and state or territory, 2018–19, AIHW.
- Australian Institute of Family Studies 2019, CFCA Resource Sheet: Child protection and Aboriginal and Torres Strait Islander children, AIFS.
- SNAICC – National Voice for our Children (SNAICC) et al 2018, Family Matters Report 2018, SNAICC, p. 10.
- Queensland Child Protection Commission of Inquiry 2013, Addressing Aboriginal and Torres Strait Islander overrepresentation, QLD Government, p. 169-170.
- Child Protection Systems Royal Commission 2016, The life they deserve: Child Protection Systems Royal Commission Report, Volume 1: Summary and Report, Government of South Australia, p. xxv.
- Family Matters 2017, Family Matters Report 2017, SNAICC – National Voice for Our Children, p. 61.
- Australian Human Rights Commissioner 1997, Bringing them home, Chapter 25: Underlying Issues, Australian Government.
- Miranti R et al. 2018, Child Social Exclusion, Poverty And Disadvantage In Australia, NATSEM, Institute for Governance and Policy Analysis (IGPA), University of Canberra.
- The type of abuse or neglect that is recorded as the ‘primary’ type is the type considered most likely to place the child at risk or be most severe in the short term.
- Australian Institute of Health and Welfare (AIHW) 2020, Child protection Australia: 2018–19, Child welfare series No 72, Cat no CWS 74, AIHW.
- Scott D 2014, Understanding child neglect: CFCA Paper No. 20, Child Family Community Australia, Australian Institute of Family Studies, p. 9.
- Doidge J et al 2017, Economic predictors of child maltreatment in an Australian population-based birth cohort, Child and Youth Services Review, Vol 72.
- Scott D 2014, Understanding Child Neglect, CFCA Paper No 20, Child Family Community Australia, Australian Institute of Family Studies.
- Markham F and Biddle N 2018, Income, Poverty and Inequality: 2016 Census Paper No. 2, Centre for Aboriginal Economic Policy Research, Australian National University, p. 16.
- Ibid, p. 16.
- Raissian K et al 2014, Child Maltreatment Reporting Patterns and Predictors of Substantiation: Comparing Adolescents and Younger Children, Child Maltreatment, Vol 19, No 1.
- Ibid.
- Australian Institute of Health and Welfare (AIHW) 2016, Vulnerable young people: interactions across homelessness, youth justice and child protection: 1 July 2011 to 30 June 2015, AIHW.
- Dean A 2018, The intersection between the child protection and youth justice systems, Child Family Community Australia, Australian Institute of Family Studies.
- Australian Institute of Health and Welfare (AIHW) 2018, Young people in child protection and under youth justice supervision: 1 July 2013 to 30 June 2017, Data linkage series no 24, Cat no CSI 26, AIHW, p. v.
- Ibid, p. 16.
- WA Department of Child Protection (no date), Leaving care to independence: A guide for carers supporting young people leaving care and transitioning to independence, WA Government.
- Department of Communities, Activity Performance Information – 2018-19, WA Government.
- Child Family Community Australia (CFCA), Supporting young people leaving out-of-home care – CFCA Paper No. 41, Australian Institute of Family Studies.
- Australian Institute of Health and Welfare (AIHW) 2018, Young people in child protection and under youth justice supervision: 1 July 2013 to 30 June 2017, Data linkage series no 24, Cat no CSI 26, AIHW, p. v.
- WA Auditor General 2018, Young People Leaving Care – Report 2 August 2018–19, WA Government, p. 5.
- Ibid, p. 5.
- McGurk S 2019, Media Statements: Home Stretch trial to provide additional support to vulnerable care leavers, WA Government [website].
- Child Family Community Australia 2017, Child Abuse and Neglect Statistics: CFCA Resource Sheet, Australian Institute of Family Studies.
- Child Family Community Australia 2017, Child Abuse and Neglect Statistics: CFCA Resource Sheet, Australian Institute of Family Studies.
- Department of Communities 2019, Casework Practice Manual, 3.4.23 Unendorsed placements, WA Government.
- Australian Institute of Health and Welfare (AIHW) 2019, National framework for protecting Australia's children indicators – 4.2 Placement stability, AIHW.
- Australian Institute of Family Studies (AIFS) 2018, CFCA Resource Sheet – Children in care, AIFS.
- McDowall JJ 2018, Out-of-home care in Australia: Children and young people’s views after five years of National Standards, CREATE Foundation, p. 28.
- There are differences across jurisdictions in the calculation of child protection expenditure. These includes where expenditure is categorised (e.g. intensive family services or protection intervention services) and how overheads are allocated. Refer to the Productivity Commission Report on Government Services for more information.
- Fox S et al 2015, Better Systems, Better Chances: A Review of Research and Practice for Prevention and Early Intervention, Australian Research Alliance for Children and Youth (ARACY), p. 38-41.
- Teager W et al 2019, How Australia can invest early and return more: A new look at the $15b cost and opportunity, Early Intervention Foundation, The Front Project and CoLab at the Telethon Kids Institute.
Last updated August 2020
While it is important for all young people in care to feel connected to their community and culture, it is particularly important for Aboriginal young people whose culture is an integral part of their identity and wellbeing. Connection to community and culture can be difficult to maintain in the child protection system.1 Furthermore, Aboriginal children are significantly overrepresented in the child protection system and are more likely to have permanent placements away from their family and community.2
The National Standards for out-of-home care have been designed to improve the quality of care provided to children and young people in care around Australia. Standards 9 and 10 relate to the right of children and young people in care to be able to maintain relationships with their birth family, culture and community.3
- Standard 9: Children and young people are supported to safely and appropriately maintain connection with family, be they birth parents, siblings or other family members.
- Standard 10: Children and young people in care are supported to develop their identity, safely and appropriately, through contact with their families, friends, culture, spiritual sources and communities and have their life history recorded as they grow up.
There are a number of mechanisms that are designed to support Aboriginal young people’s connection to culture while in care. These include compliance with the Aboriginal and Torres Strait Islander Child Placement Principle (ATSICPP) and having a cultural support plan.
The ATSICPP consists of five inter-related elements: prevention, partnership, placement, participation and connection. For further information on the ATSICPP and how it can be implemented in practice refer to the SNAICC – National Voice for our Children (SNAICC) resource: The Aboriginal and Torres Strait Islander Child Placement Principle: A guide to support implementation.
There is currently no nationally agreed measure to report on whether children have been placed into care in line with the ATSICPP.4
Action 1.3 of the Fourth Action Plan of the National Framework for Protecting Australia’s Children is to develop a nationally consistent approach to measuring the application of the five elements of the ATSICPP. Progress towards this action will be monitored and reported through the Indicators of wellbeing.
The Australian Institute of Health and Welfare (AIHW) report annually on the proportion of Aboriginal children aged 0 to 17 years in care placed with extended family or other Aboriginal caregivers (a proxy for compliance with the placement component of the ATSICPP).5
In 2018–19, AIHW reported that 61.2 per cent of Aboriginal children and young people in care in WA were placed with Aboriginal relatives or extended family members (kin), other relatives or with other Aboriginal caregivers (including family group homes and residential care run by Aboriginal caregivers). The remainder, 38.8 per cent of Aboriginal children and young people, were not placed with kin or Aboriginal caregivers.
The term ‘kin’ or ‘kinship’ care is used in the AIHW and Productivity Commission reports and by most other Australian jurisdictions to represent care by a relative or a person known to the child as a significant other. For Aboriginal children, this may include people who have a cultural, tribal or community connection with the child or young person that is recognised by that child or young person’s family or community.6
|
Aboriginal relatives, kin* |
Other relatives, kin |
Other Aboriginal caregiver |
Total placed with relatives, kin, other |
Total not placed with relatives, kin, other |
Total |
|
|
NSW |
35.6 |
22.8 |
15.9 |
74.3 |
25.7 |
100.0 |
|
VIC |
41.1 |
35.8 |
2.2 |
79.1 |
20.9 |
100.0 |
|
QLD |
21.0 |
13.9 |
14.4 |
49.2 |
50.8 |
100.0 |
|
WA |
39.4 |
12.9 |
8.9 |
61.2 |
38.8 |
100.0 |
|
SA |
31.5 |
19.4 |
11.4 |
62.3 |
37.7 |
100.0 |
|
TAS |
8.5 |
29.4 |
4.5 |
42.3 |
57.7 |
100.0 |
|
ACT |
40.2 |
22.1 |
2.0 |
64.3 |
35.7 |
100.0 |
|
NT |
31.3 |
0.0 |
5.6 |
36.9 |
63.1 |
100.0 |
|
Total |
32.8 |
19.8 |
11.6 |
64.3 |
35.7 |
100.0 |
Source: AIHW, Child Protection Report 2018–19, Table S5.12: Aboriginal and Torres Strait Islander children in out-of-home care, by relationship of carer and state or territory, 30 June 2019
Aboriginal children and young people aged 0 to 17 years in care by jurisdiction and relationship to carer, per cent, Australia, 30 June 2019
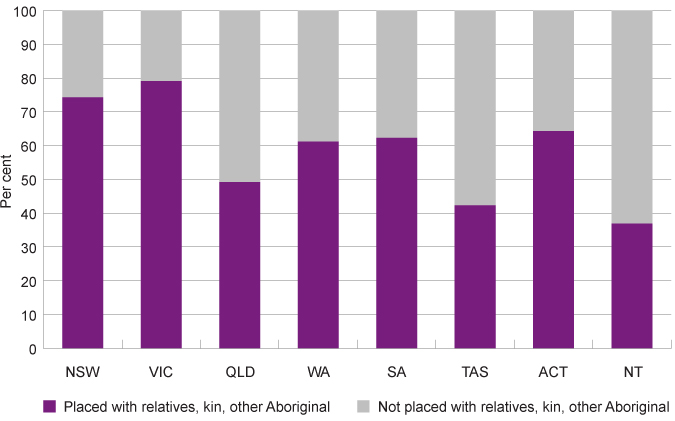
Source: AIHW, Child Protection Report 2018–19, Table S5.12: Aboriginal and Torres Strait Islander children in out-of-home care, by relationship of carer and state or territory, 30 June 2019
There is considerable variation across Australian jurisdictions in regards to the fulfilment of this principle, and WA is just below the Australian average of 65.2 per cent.
The ATSICPP placement hierarchy prioritises placement options as follows:
- With Aboriginal relatives or extended family members, or other relatives or extended family members
- With Aboriginal members of the child’s community
- With Aboriginal family-based carers.
If none of the above three options is available, then as a last resort the child may be placed with a non-Aboriginal carer or in a residential setting.7
There is criticism of the way the placement data is currently reported by AIHW, including that the definition of ‘kin’ used by child protection departments is too broad (it can include non-family members), Aboriginal carers may not be from the child’s community or country and therefore not provide a connection to their culture, and placement with non-Aboriginal family members can be detrimental over the long term if they do not support the child’s connection to culture.8,9
SNAICC also note that the published placement data includes Aboriginal children and young people in residential care settings if they are targeted towards Aboriginal children and young people, but are not necessarily run by Aboriginal community organisations. This represents the ‘last resort’ in the hierarchy and they exclude this from their analysis of compliance with the placement component.10
While recognising these limitations, this measure uses the data from the AIHW and the Productivity Commission in lieu of other data.
Over the last decade, the proportion of WA Aboriginal children and young people being placed in accordance with the placement principle has decreased from 75.3 per cent at 30 June 2009 to 61.2 per cent at 30 June 2019. As highlighted by the graph below, this is in part because of an overall increase in the number of Aboriginal children and young people in care.
|
Placed in accordance |
Not placed in accordance |
|||
|
Number |
Per cent |
Number |
Per cent |
|
|
2009 |
898 |
75.3 |
294 |
24.7 |
|
2010 |
926 |
74.8 |
312 |
25.2 |
|
2011 |
1,029 |
71.2 |
417 |
28.8 |
|
2012 |
1,094 |
69.3 |
484 |
30.7 |
|
2013 |
1,104 |
65.9 |
570 |
34.1 |
|
2014 |
1,240 |
65.9 |
642 |
34.1 |
|
2015 |
1,327 |
64.4 |
733 |
35.6 |
|
2016 |
1,384 |
62.6 |
828 |
37.4 |
|
2017 |
1,397 |
60.2 |
924 |
39.8 |
|
2018 |
1,474 |
60.1 |
978 |
39.9 |
|
2019 |
1,594 |
61.2 |
1,010 |
38.8 |
Source: Productivity Commission, Report on Government Services 2020 – Child protection services, Table 16A.21 Aboriginal and Torres Strait Islander children in out-of-home care by relationship of caregiver, 30 June
Placements of Aboriginal children and young people aged 0 to 17 years in care, complying with the placement principle of ATSICPP, number and per cent, WA, 30 June 2009 to 2019
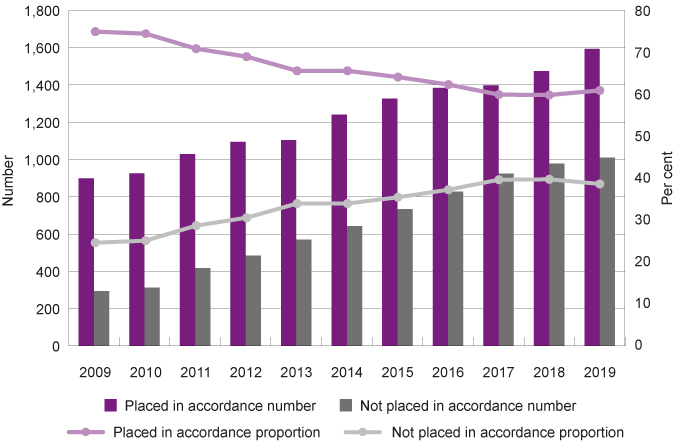
Source: Productivity Commission, Report on Government Services 2020 – Child protection services, Table 16A.21 Aboriginal and Torres Strait Islander children in out-of-home care by relationship of caregiver, 30 June
On 30 June 2009, 898 (75.3%) Aboriginal children and young people were placed in accordance with the child placement principle compared to 1,594 (61.2%) at 30 June 2019.
The Department of Communities 2018–19 Annual Report states that in 2018–19, 65.0 per cent of Aboriginal children and young people in care in WA met the first three of the four placement options under the ATSICPP placement hierarchy.11 The difference between the AIHW Child Protection Report and the Department of Communities Annual Report is principally the inclusion of unpaid placements (including unendorsed arrangements) by the Department of Communities.
Placing children and young people in the child protection system with family or kin can be difficult for a variety of reasons. These include the increasing number of Aboriginal children and young people entering care, the shortage of Aboriginal foster and family (kinship) carers, and inconsistent support for Aboriginal families, communities and organisations to participate in decision-making processes.12 Furthermore, Aboriginal families experience higher levels of poverty and disadvantage which can add financial strain when providing family care for children and young people.13
The WACOSS report, Partnering with Aboriginal Community Controlled Organisations to deliver trusted services with stronger outcomes for Aboriginal people highlighted that a shortage of Aboriginal carers was not simply due to a shortage of Aboriginal families interested in being carers, but was sometimes because potential carers did not meet the Department’s criteria, had limited financial capacity and felt that there was less support provided to Aboriginal family carers compared to foster carers.14
It should be noted that placement with an Aboriginal caregiver (family or other) may meet the placement component of the ATSICPP but does not mean the other components (prevention, partnership, participation and connection) have been, and are being, complied with.15
For example, SNAICC performed a baseline analysis of compliance with the ATSICPP in WA and noted in particular that policies and procedures do not mandate participation or even efforts to enable or facilitate the participation of children, families and communities in decision making.16 There was, however, also recognition that the Department of Communities is making changes as part of their reform agenda.17
Endnotes
- Krakouer J et al 2018, “We Live and Breathe Through Culture”: Conceptualising Cultural Connection for Indigenous Australian Children in Out-of home Care, Australian Social Work, Vol 71, No 3.
- Child Family Community Australia (CFCA) 2019, Child Protection and Aboriginal and Torres Strait Islander children, Australian Institute of Family Studies.
- Department of Social Services 2011, An outline of National Standards for out-of-home care, Commonwealth of Australia.
- Australian Institute of Health and Welfare 2018, Indicator Quick Reference Guide: National Framework for Protecting Australia’s Children – outlines that Placement of Indigenous children (compliance) has no data and that an indicator is still to be developed.
- Australian Institute of Health and Welfare (AIHW) 2019, National framework for protecting Australia's children indicators – Kinship Placement, AIHW.
- Kiraly M 2018, Support for children in kinship care provided by the Commonwealth, States & Territories of Australia: Report of national policy survey, The Association of Children’s Welfare Agencies, p. 5.
- SNAICC – National Voice for Our Children (SNAICC) 2019, The Aboriginal and Torres Strait Islander Placement Principle: A Guide to Support Implementation, SNAICC, p. 45.
- Family Matters 2019, Family Matters Report 2018, SNAICC – A National Voice for Our Children, p. 73-74
- Higgins D et al 2005, Enhancing out-of-home care for Aboriginal and Torres Strait Islander young people, Australian Institute of Family Studies, p. 58-59.
- Family Matters 2019, Family Matters Report 2018, SNAICC – A National Voice for Our Children, p. 74.
- Department of Communities 2019, Annual Report: 2018-19, WA Government, p. 150.
- Australian Institute of Family Studies (AIFS) 2016, AIFSEnhancing the implementation of the Aboriginal and Torres Strait Islander Child Placement Principle,
- Family Matters 2019, Family Matters Report 2018, SNAICC – A National Voice for Our Children, p. 74.
- West Australian Council of Social Service (WACOSS) and Noongar Family Safety and Wellbeing Council 2019, Partnering with Aboriginal Community Controlled Organisations to deliver trusted services with stronger outcomes for Aboriginal people, WACOSS, p. 23.
- Australian Institute of Family Studies (AIFS) 2016, Enhancing the implementation of the Aboriginal and Torres Strait Islander Child Placement Principle, AIFS.
- SNAICC – National Voice for Our Children (SNAICC) 2018, Baseline Analysis of Best Practice Implementation of the Aboriginal and Torres Strait Islander Child Placement Principle: Western Australia, SNAICC.
- SNAICC – National Voice for Our Children (SNAICC) 2018, Baseline Analysis of Best Practice Implementation of the Aboriginal and Torres Strait Islander Child Placement Principle: Western Australia, SNAICC.
Last updated August 2020
At 30 June 2019, there were 2,420 WA young people in care aged between 10 and 17 years, more than one-half of whom (53.3%) were Aboriginal.1
Although children and young people are placed into care to protect them from child abuse and neglect at home, evidence suggests that out-of-home care is not always a safe place, with some research showing higher prevalence rates of abuse in the care system than in the general population.2,3
There is limited data on the prevalence of abuse or neglect within the care system.
Standard One of the National Standards for out-of-home care states that ‘children and young people will be provided with stability and security during their time in care’. This is planned to be measured using the rate and number of children in out-of-home care who were the subject of a child protection substantiation and the person believed responsible was living in the household providing out-of-home care.4
The Productivity Commission Report on Government Services reports on children in care who were the subject of a substantiation of abuse or neglect. In this measure ‘the person responsible can be anyone who encounters the child while the child is in out-of-home care (that is, not limited to a person living in the household)’. The Productivity Commission note this data is experimental and should be interpreted with caution due to the collection methods employed by the various jurisdictions.5
In 2018–19, 88 WA children and young people in care (aged 0 to 17 years) were reported as subject of a notification which was substantiated.6 Furthermore, there were no WA children and young people in care in 2018–19 reported as subject of a substantiated notification where the person responsible was the approved foster carer.7
The Royal Commission into Institutional Responses to Child Sexual Abuse (the Royal Commission) found that sexual abuse by carers, their family members, visitors, caseworkers and other children and young people in care continues to occur in care, and that sexual exploitation is a growing concern, especially for children and young people in residential care.8 The Royal Commission identified persistent weaknesses and systemic failures that continue to place children and young people in care at risk of sexual abuse.9
Of the survivors who reported their experiences, most were sexually abused by an adult, including a foster or kinship carer, another adult in the household, or a residential care worker. Some survivors reported being abused by other children and young people in care, this was particularly high in residential care.10
The Royal Commission found residential care held particular risks for children and young people. These included the challenges associated with caring for vulnerable groups of young people in the same facility including young people who may have exhibited potentially harmful sexual behaviours, many of whom have previously been sexually abused. These risks are compounded by high turnover of staff, use of casual labour and lack of staff training, supervision and support.11
However, research also suggests that violence more broadly may be an issue for families providing kinship care. In online survey research in Victoria one-half of the participating kinship carers experienced physical abuse and violence from a family member of children being cared for. While just under one-half of the carers reported experiencing family violence caused by the child in care.12 It should be noted that this survey was not a representative sample and does not provide an indication of the prevalence of violence for kinship carers more broadly.13
In 2018 AIHW presented data on the views of children and young people in out-of-home care collected by all Australian jurisdictions as part of their local case management processes. Across Australia, 92 per cent of children and young people in care (aged eight to 17 years) reported feeling both safe and settled in their current placement. These results differed depending on living arrangements, with approximately 95 per cent of children and young people in foster care and family (kinship) care reporting they felt safe and settled, compared to only 69 per cent in residential care.14
In 2016, CREATE Foundation spoke with 25 WA children and young people with a care experience aged between 7 and 25 years of age about what they thought they needed in care. While this is a very small number of children and young people, it is nevertheless important to listen to their perspectives.
The children and young people spoke about the importance of having a safe environment to live in while they were in care, and that there needs to be physical safety for children and young people. They mentioned specific factors that created a safe environment including lockable doors for privacy and a space where they could calm down if needed. Some participants spoke about the need to ensure that children and young people are protected and safe from other children and young people in the placement.15
Participants also explained that it was really important that adults were communicating and speaking with children and young people to see if they felt safe or not, and that children and young people were listened to, taken seriously and supported if they felt unsafe.16
In 2016, the Commissioner for Children and Young People WA asked 96 children and young people aged eight to 24 years with experience of care about their views on raising concerns and making complaints.17 In this consultation, strong themes emerged with regards to barriers to speaking up that many children and young people in care face, including:
- fear of the consequences
- being told not to speak up
- not knowing how to or not having the words to articulate concerns
- not having anyone to speak to or anyone who would listen
- fear of not being believed
- isolation and lack of privacy
- a lack of confidence or feeling scared
- shame
- an imbalance of power.
These barriers highlight how important it is that children and young people in care understand their rights to voice their concerns, are informed on who they can talk to and how they can access help, feel confident and have access to people and services to support them. For more information refer to:
Commissioner for Children and Young People WA 2016, Speaking Out About Raising Concerns in Care. Commissioner for Children and Young People WA.
CREATE Foundation 2020, Best Practices Guide: Child-centre complaints handling, CREATE Foundation.
Endnotes
- Department of Communities 2019, Annual Report: 2018-19, WA Government p. 26.
- Euser S et al 2013, The Prevalence of Child Sexual Abuse in Out-of-Home Care: A Comparison Between Abuse in Residential and in Foster Care, Child Maltreatment, Vol 19, No 4.
- Euser S et al 2014, Out of home placement to promote safety? The prevalence of physical abuse in residential and foster care, Children and Youth Services Review, Vol 37.
- Department of Social Services 2011, An outline of National Standards for out-of-home care, Commonwealth of Australia.
- Australian Institute of Health and Welfare (AIHW) 2019, Appendix C: Policy and practice differences in states and territories, AIHW, p. 10.
- Productivity Commission 2019, Report on Government Services: Child Protection Services, Productivity Commission, p. 16.15.
- Productivity Commission 2020, Report on Government Services: Child Protection Services – Table 16A.13 and 16A.14 Children in out-of-home care who were the subject of a substantiation of sexual abuse, physical abuse, emotional abuse or neglect, Productivity Commission.
- Royal Commission into Institutional Responses to Child Sexual Abuse 2017, Volume 12: Contemporary Out-of-home care, Commonwealth of Australia, p. 9.
- Ibid, p. 9.
- Ibid, p. 13.
- Royal Commission into Institutional Responses to Child Sexual Abuse 2017, Volume 12: Contemporary Out-of-home care, Commonwealth of Australia, p. 14-15.
- Breman R and MacRae A 2017, ‘It’s been an absolute nightmare’ Family violence in kinship care, Baptcare.
- The online survey link was emailed to former and current kinship carers in Victoria. The link was distributed to both informal and formal kinship carers. Since the intention of this study was to describe the carers and children’s experience of violence and abuse and the impact this violence has had on them, recruitment of participants was specifically targeted towards kinship carers who had direct experience of family violence since their placement started. No information was obtained about the prevalence of family violence in kinship placements in Victoria. Source: Breman R and MacRae A 2017, ‘It’s been an absolute nightmare’ Family violence in kinship care, Baptcare, p. 10.
- Australian Institute of Health and Welfare (AIHW) 2019, The views of children and young people in out-of-home care: overview of indicator results from the second national survey 2018, Cat No CWS 68, AIHW, p. iv.
- CREATE Foundation 2017, Standards of Out-of-Home Care Consultation Report – Western Australia (2017), CREATE Foundation, p. 11-12.
- Ibid, p. 12.
- Commissioner for Children and Young People WA 2016, Speaking Out About Raising Concerns in Care. Commissioner for Children and Young People WA.
Last updated August 2020
The Australian Bureau of Statistics Disability, Ageing and Carers, 2018 data collection reports that approximately 30,200 WA children and young people (9.2%) aged five to 14 years have reported disability.1,2
While there is limited data, research shows that children and young people with disability have a higher risk of being unsafe in their homes and have a greater risk of experiencing child abuse and neglect.3,4,5
In 2019, the Commissioner for Children and Young People (the Commissioner) conducted the Speaking Out Survey which sought the views of a broadly representative sample of Year 4 to Year 12 students in WA on factors influencing their wellbeing.6 This survey was conducted across mainstream schools in WA; special schools for students with disability were not included in the sample.
In this survey Year 7 to Year 12 students were asked: Do you have any long-term disability (lasting 6 months or more) (e.g. sensory impaired hearing, visual impairment, in a wheelchair, learning difficulties)? In total, 315 (11.4%) participating Year 7 to Year 12 students answered yes to this question.
A substantial proportion of students responded ‘I don’t know’ to this question and their wellbeing scores are generally less favourable than both other groups. Further analysis of these young people’s experiences will be undertaken in the future.
Due to the relatively small sample size, the following results for students who reported long-term disability are observational and not representative of the full population of students with disability in Years 7 to 12 in WA. Comparisons between participating students with and without disability are therefore not statistically significant. Nevertheless, the results provide an indication of the views and experiences of young people with disability about safety in the home.
Young people with disability were less likely to feel safe at home than young people without disability. Among Year 7 to Year 12 students with disability, 57.0 per cent reported they felt safe at home all the time and 27.2 per cent felt safe most of the time. Despite the low sample size, it is most concerning that more than 5 per cent (5.4%) of students with disability reported feeling safe at home only a little bit of the time (3.9%) or never (1.5%).
|
Young people with disability |
Young people without disability |
|
|
All of the time |
57.0 |
63.2 |
|
Most of the time |
27.2 |
28.5 |
|
Sometimes |
9.1 |
4.0 |
|
A little bit of the time |
3.9 |
2.0 |
|
Never |
1.5 |
0.7 |
|
Does not apply to me |
1.0 |
0.9 |
|
Prefer not to say |
0.2 |
0.7 |
Source: Commissioner for Children and Young People WA 2020, Speaking Out Survey 2019 Data Tables [unpublished]
There was a substantial difference between responses of male and female students with disability, with female respondents being less likely than male respondents to report feeling safe all the time (52.0% female compared to 64.0% male).7
Forty per cent (40.5%) of students with disability reported they had ever stayed away from home overnight because of a problem. This is a substantially higher proportion than that measured for students without disability (27.7%).8
Participants in the Speaking Out Survey were also asked whether they were worried about someone in their home or family fighting. Less one-half of students with disability (44.7%) reported they were not at all worried that someone in their home or family will be fighting. One-quarter (25.4%) were a little worried, 15.2 per cent were somewhat worried and 14.8 per cent were worried a lot. The proportion of students who worried a lot is higher for students with disability than without (14.8% compared to 10.3%).
|
Young people with disability |
Young people without disability |
|
|
A lot |
14.8 |
10.3 |
|
Somewhat |
15.2 |
14.0 |
|
A little |
25.4 |
26.1 |
|
Not at all |
44.7 |
49.6 |
Source: Commissioner for Children and Young People WA 2020, Speaking Out Survey 2019 Data Tables [unpublished]
These results suggest that a substantial proportion of young people with disability do not feel safe in their homes and/or are worried about their family fighting which aligns with research findings that children and young people with disability have a higher risk of abuse and neglect.9
There are currently no nationally consistent data sets available to monitor the extent of violence, abuse and neglect of children and young people with disability.10 The Australian Institute of Health and Welfare is working with the Australian and state/territory governments to better identify children with disability within jurisdictional child protection systems.11
In 2018–19, 491 WA children and young people in care (10.3%) were reported as having a disability, 3,076 (64.7%) were reported as having no disability and 1,187 (25.0%) had no disability status recorded.12 It should be noted that there is evidence to suggest many children in care may be living with undiagnosed Fetal Alcohol Spectrum Disorder (FASD).13
A WA study using linked administrative health and child protection data found that although children and young people with disabilities made up 10.4 per cent of the population, they represented 25.9 per cent of children and young people with a maltreatment allegation and 29.0 per cent of those with a substantiated notification.14 The risk of maltreatment was not consistent across all disability types. Children and young people with intellectual disability, mental/behavioural problems, and conduct disorder had a greater risk of maltreatment than children with other types of disability.15
The Royal Commission into Violence, Abuse, Neglect and Exploitation of People with Disability has been established to specifically address evidence that people with disability are being abused in institutional and other settings. This Royal Commission is currently receiving submissions and holding hearings.
The Royal Commission into Institutional Responses to Child Sexual Abuse found that children with disability who disclosed sexual abuse were often not believed or their distress was explained as a function of their disability. Furthermore, survivors with communication and cognitive impairments were reliant on supportive adults noticing and understanding changes in their behaviour after the abuse.16
Endnotes
- ABS uses the following definition of disability: ‘In the context of health experience, the International Classification of Functioning, Disability and Health (ICFDH) defines disability as an umbrella term for impairments, activity limitations and participation restrictions… In this survey, a person has a disability if they report they have a limitation, restriction or impairment, which has lasted, or is likely to last, for at least six months and restricts everyday activities.’ Australian Bureau of Statistics 2016, Disability, Ageing and Carers, Australia, 2015, Glossary.
- Estimate is to be used with caution as it has a relative standard error of between 25 and 50 per cent. Australian Bureau of Statistics 2016, Disability, Ageing and Carers, Australia, 2018: Western Australia, Table 1.1 Persons with disability, by age and sex, estimate and Table 1.3 Persons with disability, by age and sex, proportion of persons.
- Maclean M et al 2017, Maltreatment Risk Among Children With Disabilities, Pediatrics, Vol 139, No 4.
- Jones L et al 2012, Prevalence and risk of violence against children with disabilities: a systematic review and meta-analysis of observational studies, Lancet, Vol 380.
- Wayland S and Hindmarsh G 2017, Understanding safeguarding practices for children with disability when engaging with organisations, Child Family Community Australia, Australian Institute of Family Studies, p. 3.
- Commissioner for Children and Young People WA 2020, Speaking Out Survey: The views of WA children and young people on their wellbeing - a summary report, Commissioner for Children and Young People WA.
- Commissioner for Children and Young People WA 2020, Speaking Out Survey 2019 Data Tables, Commissioner for Children and Young People WA, [unpublished].
- Commissioner for Children and Young People WA 2020, Speaking Out Survey 2019 Data Tables, Commissioner for Children and Young People WA, [unpublished].
- Wayland S and Hindmarsh G 2017, CFCA Practitioner Resource: Understanding safeguarding practices for children with disability when engaging with organisations, Australian Institute of Family Studies.
- Community Affairs References Committee 2015, Violence, abuse and neglect against people with disability in institutional and residential settings, including the gender and age related dimensions, and the particular situation of Aboriginal and Torres Strait Islander people with disability, and culturally and linguistically diverse people with disability, Commonwealth of Australia, p. 37.
- Australian Institute of Health and Welfare (AIHW) 2019, Child protection Australia: 2017–18, AIHW, p. 6.
- Australian Institute of Health and Welfare (AIHW) 2020, Child protection Australia: 2018–19, Data Tables – Table S5.8: Children in out-of-home care, by disability status and state or territory, 30 June 2019, AIHW. As disability is a multidimensional and complex concept, there are differences in how information about disability is captured in jurisdictional processes and client information systems, including how disability is defined and which health conditions are classified as a disability.
- McLean S and McDougall S 2014, Fetal alcohol spectrum disorders: Current issues in awareness, prevention and intervention, CFCA Paper No 20, Child Family Community Australia (CFCA).
- Maclean M et al 2017, Maltreatment Risk Among Children With Disabilities, Pediatrics, Vol 139, No 4.
- Jones L et al 2012, Prevalence and risk of violence against children with disabilities: a systematic review and meta-analysis of observational studies, Lancet, Vol 380.
- Royal Commission into Institutional Responses to Child Sexual Abuse 2017, Final Report: Preface and executive summary, Australian Government, p. 14.
Last updated August 2020
Feeling safe at home is essential for young people’s healthy development. A safe home underpins young people’s sense of identity and independence and provides feelings of security and belonging which support young people’s social and emotional wellbeing.1,2
Young people who are not safe and supported in their home are more likely to have poor outcomes in both the short and long-term including reduced school attendance and performance, higher rates of alcohol and substance abuse, risk of mental health issues, homelessness and the potential for behavioural issues, including antisocial behaviour.3
This indicator considers whether WA young people feel and are safe at home. This is a broad topic which encompasses a continuum of issues from not feeling safe at home due to sibling bullying through to family and domestic violence and child abuse occasioning child protection involvement.
Feeling safe at home
The Speaking Out Survey 2019 found that 37.2 per cent of Year 7 to Year 12 students in WA do not always feel safe at home. More research is required to better understand the drivers of this finding and how it relates to direct experiences of harm.
Supporting families to foster a safe environment at home for young people aged 12 to 17 years requires a number of areas of focus:
- Qualitative research is required on young people’s views on safety at home to determine when they feel safe and unsafe, and what they need to help them feel safe.
- Continued general information campaigns for families on how to build safe and respectful relationships with teenagers, including having respectful discussions about diversity and choice.
- Services targeted to vulnerable young people including those with mental health issues or experiencing parental conflict and family violence and for particular populations such as LGBTI and CALD young people.
- Policies which are focused on reducing disadvantage and social exclusion more broadly, which can reduce social stressors in socially and economically disadvantaged communities.4,5
Family and domestic violence
Family and domestic violence is a key contributor to young people not feeling, or being, safe in their home. It can affect a young person’s coping mechanisms and sense of self, has the potential to cause a state of hyper-vigilance and in some cases can manifest as post-traumatic stress disorder.6
The causes of family and domestic violence are complex. Violence against women is linked to gender inequality reinforced through gender stereotypes. It is further influenced by factors including intergenerational abuse and trauma, exposure to violence as a child, social and economic exclusion, drug and alcohol misuse and mental illness.7
While there has been a significant policy focus on family and domestic violence in Australia over the last 10 years, how to address the impact on children and young people has been less considered. To do this effectively, it is essential that the voices of children and young people who have experienced family and domestic violence are brought to the fore.
Across Australia, there is a higher rate of family and domestic violence in Aboriginal families than non-Aboriginal families.8 This should be understood in the context of a history of colonisation, forced child removal, significant social and economic disadvantage and intergenerational trauma.9
Providing improved support to young people and their families experiencing family and domestic violence requires the following:
- Engagement with children and young people who have experienced family and domestic violence to gain an understanding of what they need to support them.
- Further work to integrate services that address the multiple factors that increase the risk of family and domestic violence occurring, including mental health issues and drug and alcohol misuse.
- It is essential that services are provided directly for children and young people who experience violence in their homes. Children and young people need to be treated as victims in their own right with their own needs.
- Improved services responses for children and young people with disability, those who identify as LGBTI and CALD children and young people.
- Continued effort to improve access to safe and stable housing for women who choose to leave violent relationships, and to develop approaches to enable women and children to stay (safely) in their home while the perpetrator is removed.10
- A whole-of-government response to reducing childhood poverty, with a focus on Aboriginal children and young people, should be considered at both a state and national level.
- Services and programs to address family and domestic violence in Aboriginal communities, must be Aboriginal-led and tailored to local needs. Wherever possible, service providers should be from Aboriginal Community Controlled Organisations and non-Aboriginal service providers must be culturally safe and trauma competent.11
- For young people exhibiting violent behaviours in the home, targeted interventions are required, while supporting and maintaining family relationships and connections, within the context of family safety.12
Child protection system
There has been a sustained increase in the number and rate of children and young people in care over the last decade. Research suggests that this increase is associated with an increase in the number of families and children experiencing multiple forms of social and economic disadvantage.13
For more than one-quarter (26.9%) of the children and young people who have had contact with the child protection system, the primary reason was neglect. Research has shown a strong and consistent link between neglect and economic disadvantage.14 Policies which address poverty and disadvantage more broadly are essential.
It is important to build the capacity of parents, caregivers and families so they are supported to provide environments in which their children can be healthy, safe, engaged in learning and have opportunities to thrive. This requires the following areas of focus:
- There is a critical need to more effectively address the leading social determinants of child abuse and neglect: domestic violence, mental illness, and substance misuse.15 Greater collaboration between services is required to address each family’s specific needs, this might include coordination between drug and alcohol services, specialist family violence services and mental health programs.16
- Families experiencing multiple long term complex challenges require intensive support to make changes to be able to provide a safe and supportive home for their children. Services provided should be holistic, strength-based and non-judgemental.
- Early intervention services that respond to family and community needs are critical in order to reduce the number of children and young people entering care and to maximise the prospect of reunification with their family if they are placed in care. Supports and interventions that do not address the home, school and community environments in which children live are unlikely to be effective or sustainable.
- High-quality data outlining community, group or individual vulnerability is essential to identify children and young people who are at risk. Data such as school attendance rates, Australian Early Development Census data provide indicators of children and young people who may be at risk of harm.17,18
- At the same time, intensive family support services need to be evaluated and shown to be effective in addressing the risk of abuse and neglect in highly vulnerable families.19
Despite policy commitments and public discussion, there has been no progress in reducing the overrepresentation of Aboriginal children and young people in the child protection system. Addressing the underlying causes of the poor health and wellbeing in Aboriginal communities is essential to most effectively bring about change, and must include recognition of the pervasive nature of trauma in Aboriginal people’s lives.20
Reducing Aboriginal children and young people’s overrepresentation in the child protection system requires a number of areas of focus:
- Programs and services working in the Aboriginal community must be Aboriginal-led, rights-based, client (child) centred, place-based, appropriately resourced and evaluated.
- Services engaging with Aboriginal and Torres Strait Islander families should aim to build on existing family strengths to assist families to develop healthy relationships to care for themselves and their children.21
- Service providers who work with Aboriginal children and young people (including teachers, workers in child protection, mental health and youth justice) must be trauma competent – better training is needed for all these workers to understand the magnitude of the historical and contemporary trauma experienced by Aboriginal people.22
In 2019, the WA Government has announced a new initiative to consult with SNAICC – National Voice for our Children and local Aboriginal communities to develop a new action plan to reduce the overrepresentation of Aboriginal children and young people in the child protection system.23
It is essential to improve the child protection system more broadly in WA to more effectively respond to the needs of vulnerable children and young people. Numerous inquiries into Australian child protection systems have consistently highlighted issues of inadequate workforce capacity and poor quality of practice and decision making.24
Young people leaving the care system are particularly vulnerable to adverse outcomes, including mental health issues, low levels of education, homelessness and high risk of involvement with the youth justice system. In 2018 the WA Auditor General concluded that about 65 per cent of young people leaving care who were eligible for support did not get it early enough, or at all.25 The review also determined that the Department of Communities does not know if young people leaving its care receive the support they need, or what happens to them.26
It is essential that the State Government implement the recommendations of the Auditor General to ensure young people leaving the care system are adequately supported.
Data gaps
No data is currently available on the prevalence or incidence of childhood experiences of family and domestic violence and child abuse and neglect. It is expected that this gap will be at least partially addressed by the Australian Child Maltreatment Study funded by the National Health and Medical Research Council. This study will involve a national survey of 10,000 randomly selected participants to determine the prevalence of child maltreatment in Australia.
There is a limited data on the experiences and prevalence of family and domestic violence, abuse and neglect for specific groups of young people including Aboriginal young people, young people with disability, LGBTI young people and CALD young people.
There is considerable data available on the number of children in the child protection system and their various interactions with child protection services. There is, however, very limited data on whether the child protection system is improving these young people’s lives. Data on the outcomes for young people in the WA child protection system, not simply the services provided to them, is essential.
Endnotes
- Lawrence C 2019, The Effects of Physical and Social Environments on the Health and Wellbeing of Children and Young People, Commissioner for Children and Young People.
- Mullan K and Higgins D 2014, A safe and supportive family environment for children: key components and links to child outcomes – Occasional Paper No 52, Department of Social Services, p. viii
- Hunter C 2014, Effects of child abuse and neglect for children and adolescents, National child Protection Clearinghouse Resource Sheet, Australian Institute of Family Studies.
- Webster C and Kingston S 2014, Crime and Poverty, in Reducing Poverty in the UK: A collection of evidence review, Joseph Rowntree Foundation, p. 148.
- Schwartz M 2010, Building communities, not prisons: Justice reinvestment and Indigenous over-imprisonment, Australian Indigenous Law Review, Vol 14, No 1.
- Laing L 2000, Children, young people and domestic violence, Issues Paper no. 2, Australian Domestic and Family Violence Clearinghouse.
- State of Victoria 2016, Royal Commission into Family Violence: Summary and recommendations, Parl Paper No 132, p. 2.
- Australian Institute of Health and Welfare 2019, Family, domestic and sexual violence in Australia: continuing the national story 2019, Cat no FDV 3, AIHW, p. 106.
- Campo M and Tayton S 2015, Domestic and family violence in regional, rural and remote communities: An overview of key issues, Child Family Community Australia, Australian Institute of Family Studies.
- State of Victoria 2016, Royal Commission into Family Violence: Summary and recommendations, Parl Paper No 132, p. 22.
- Commissioner for Children and Young People 2019, Improving the odds for WA’s vulnerable children and young people, Commissioner for Children and Young People WA.
- Howard J 2015, Adolescent violence in the home: How is it different to adult family violence?, Child Family Community Australia, Australian Institute of Family Studies.
- Pilkington R 2017, Child Protection in South Australia, BetterStart Child Health and Development Research Group, School of Public Health, The University of Adelaide.
- Doidge J et al 2017, Economic predictors of child maltreatment in an Australian population-based birth cohort, Child and Youth Services Review, Vol 72.
- Bromfield L et al 2014, Contemporary issues in child protection intake, referral and family support, in Families, policy and the law: Selected essays on contemporary issues for Australia, Australian Institute of Family Studies.
- State of Victoria 2016, Royal Commission into Family Violence: Summary and recommendations, Parl Paper No 132, p. 23.
- Green M et al 2017, Childhood Maltreatment and Early Developmental Vulnerabilities at Age 5 Years, Child Development, Vol 89, No 5.
- Hagborg J et al 2018, Evidence for a relationship between child maltreatment and absenteeism among high-school students in Sweden, Child Abuse & Neglect, Vol 75.
- Bromfield L et al 2014, Contemporary issues in child protection intake, referral and family support, in Families, policy and the law: Selected essays on contemporary issues for Australia, Australian Institute of Family Studies.
- The Lowitja Institute 2018, Journeys to Healing and Strong Wellbeing Final Report, The Lowitja Institute.
- SNAICC – National Voice for our Children 2019, Eight Priorities, SNAICC [website].
- Commissioner for Children and Young People 2019, Improving the odds for WA’s vulnerable children and young people, Commissioner for Children and Young People WA.
- McGurk S 2019, Media Statements: Two major announcements for National Child Protection Week, WA Government.
- Finan S et al 2018, Assessing the quality and comprehensiveness of child protection practice frameworks, Australian Centre for Child Protection, University of South Australia.
- WA Auditor General 2018, Young People Leaving Care – Report 2 August 2018-19, WA Government, p. 5.
- Ibid, p. 6.
For more information on safety in the home for young people refer to the following resources:
- Australian Institute of Health and Welfare (AIHW) 2019, Child Protection Australia 2018–19, AIHW.
- Australian Institute of Health and Welfare (AIHW) 2019, Young people in child protection and under youth justice supervision: 1 July 2014 to 30 June 2018, Data linkage series no 25, Cat no CSI 27, AIHW.
- Campo M 2015, Children’s exposure to domestic and family violence: CFCA Paper No. 36, Australian Institute of Family Studies.
- Child Family Community Australia 2017, The prevalence of child abuse and neglect - CFCA Resource Sheet— April 2017, Australian Institute of Family Studies.
- Family Matters 2019, The Family Matters Report 2019, SNAICC – National Voice for Our Children.
- Mullan K and Higgins D 2014, A safe and supportive family environment for children: key components and links to child outcomes – Occasional Paper No 52, Department of Social Services.
Endnotes
- Mullan K and Higgins D 2014, A safe and supportive family environment for children: key components and links to child outcomes – Occasional Paper No 52, Department of Social Services, p. 2.
- Hunter C 2014, Effects of child abuse and neglect for children and adolescents, National Child Protection Clearinghouse Resource Sheet, Australian Institute of Family Studies.