


Material basics

The material circumstances of their family is a significant contributor to a child’s health and wellbeing. Access to basic material needs such as adequate nutrition, healthcare and security of housing protects against the risks of ongoing disadvantage.
In general, children from low socioeconomic backgrounds are at greater risk of poor health over their lifetime, including higher rates of illness, disability and death.1 Children experiencing material deprivation, social exclusion or homelessness are also more likely than other children to experience psychological or socio-emotional difficulties, behavioural problems, educational difficulties and mental health issues.2,3
Last updated August 2020
Some data is available on whether WA children aged 6 to 11 years are provided with the material basics they need.
Overview
This indicator considers three key measures of socioeconomic disadvantage: financial disadvantage, social exclusion and homelessness and housing stress.
There is no agreed national definition of child poverty and it is not measured on a regular basis by any government department – state or federal.
Areas of concern
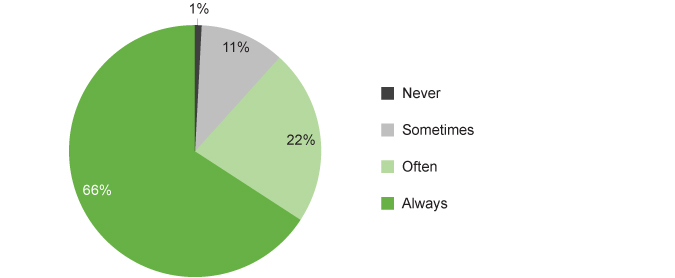
While most children in Year 4 to Year 6 in WA report that there is enough food to eat at home, more than 10 per cent (10.9%) said they only sometimes have enough food to eat at home if they are hungry. A small proportion (0.5%) reported there is never enough food to eat in their home.
It is estimated that in 2016, 17.0 per cent of WA children and young people aged 0 to 14 years were living in a household in poverty.
Children living in remote and very remote areas in WA have a very high risk of social exclusion.
In 2016, there were 1,208 WA children aged 0 to 11 years who were reported as homeless. Almost one-half (48.9%) of all WA children and young people seeking homelessness assistance in 2017–18 needed help due to family and domestic violence.
Aboriginal children are disproportionately impacted by homelessness.
Last updated August 2020
It is well established that child poverty is a critical issue and that children experiencing financial disadvantage are at greater risk of poor health and wellbeing outcomes in the short and long term.1
There are multiple measures of financial disadvantage including measures of material deprivation, relative income poverty and low-income families. These measure different aspects of financial disadvantage and provide different insights.
Financial disadvantage can affect children in the family through the reduced provision of appropriate housing, heating, nutrition and medical care.2 Children from families under financial strain are also more likely to experience psychological or socio-emotional difficulties, behavioural problems, educational difficulties and mental health issues.3,4
There is some data available on financial disadvantage experienced by WA children aged six to 11 years.
Material deprivation
Most data on child poverty is calculated from household incomes.5 However, it is increasingly recognised that poverty rates and income measures do not take into account children’s experiences and assume that children in poor households are missing out on essentials. However, not all children in poor families will go without, as many parents will deprive themselves of necessities while ensuring their children have what they need.
Deprivation measures take into account income, wealth and also expenditure, thus including households which may have higher expenses, perhaps due to health costs.6 Measures of deprivation or financial stress are therefore grounded in the living standards and experiences of people in poverty.7
A child-centred material deprivation approach measures whether children do not have items or experiences that they want and are considered essential by their peers. These could include breakfast each day, appropriate clothing or ability to go on school excursions.8 It is therefore a measure of ‘missing out’ on essentials.9 A child-centred approach to material deprivation captures the attitudes, views and experiences of children and young people.
In 2019, the Commissioner conducted the Speaking Out Survey which sought the views of a broadly representative sample of 4,912 Year 4 to Year 12 students in WA on factors influencing their wellbeing, including a range of questions about material deprivation.
While most children in Year 4 to Year 6 in WA report that there is enough food to eat at home, more than 10 per cent (10.9%) said they only sometimes have enough food to eat at home if they are hungry. A small proportion (0.5%) reported there is never enough food to eat in their home.
|
Male |
Female |
Metropolitan |
Regional |
Remote |
Total |
|
|
Never |
0.5 |
0.6 |
0.4 |
1.2 |
N/A |
0.5 |
|
Sometimes |
11.2 |
10.5 |
9.5 |
14.2 |
17.0 |
10.9 |
|
Often |
23.6 |
21.0 |
24.1 |
19.8 |
14.0 |
22.6 |
|
Always |
64.7 |
68.0 |
65.9 |
64.9 |
69.0 |
66.0 |
Source: Commissioner for Children and Young People WA 2020, Speaking Out Survey 2019 Data Tables [unpublished]
N/A – Data not published where the number of students providing data for that response was less than 5.
Proportion of Year 4 to Year 6 students reporting they had enough food to eat in their home if they were hungry, always, often, sometimes or never, per cent, WA, 2019
Source: Commissioner for Children and Young People WA 2020, Speaking Out Survey 2019 Data Tables [unpublished]
There were no significant differences for male and female children however a significantly greater proportion of children living in remote areas reported not having enough food to eat, compared to the metropolitan area (17.0% in remote areas compared to 9.5% in the metropolitan area).
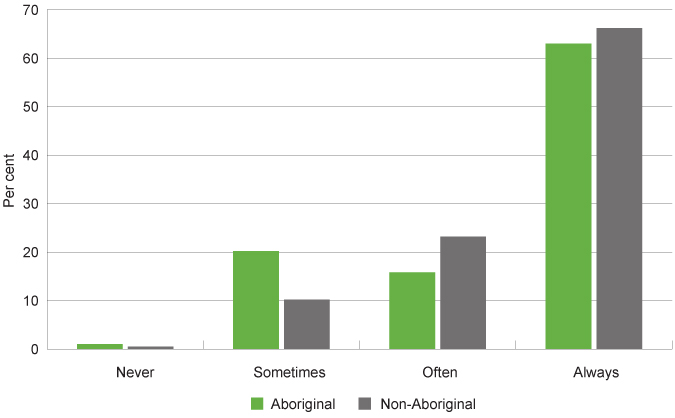
A significantly higher proportion of Aboriginal Year 4 to Year 6 students than non-Aboriginal students reported they had enough food at home only sometimes or never (21.2% compared to 10.7%).
|
Aboriginal |
Non-Aboriginal |
|
|
Never |
1.0 |
0.5 |
|
Sometimes |
20.2 |
10.2 |
|
Often |
15.8 |
23.2 |
|
Always |
63.0 |
66.2 |
Source: Commissioner for Children and Young People WA 2020, Speaking Out Survey 2019 Data Tables [unpublished]
Proportion of Year 4 to Year 6 students reporting they had enough food to eat in their home if they were hungry, all of the time, most of the time, sometimes or never by Aboriginal status, per cent, WA, 2019
Source: Commissioner for Children and Young People WA 2020, Speaking Out Survey 2019 Data Tables [unpublished]
International research demonstrates that food insecurity is associated with academic, behavioural, emotional and health problems for children.10,11 The Speaking Out Survey data shows a relationship between having enough food to eat at home and students’ ratings of their general health. One-quarter (26.7%) of Year 4 to Year 6 students who do not always have enough food to eat at home rate their health as fair or poor, compared to 4.2 per cent of students who always have enough food at home.12
Almost all (95.6%) of Year 4 to Year 6 students reported that their family has at least one car. However, a significantly greater proportion of Aboriginal than non-Aboriginal students reported that their family did not have a car (12.8% compared to 5.3%).
Aboriginal students in Year 4 to Year 6 were also significantly less likely than non-Aboriginal students to have enough money to go on a school camp or excursion (81.2% compared to 90.1%). The gap between Aboriginal and non-Aboriginal students having enough money for school excursions was particularly marked in remote areas (77.8% compared to 91.2%).
|
Aboriginal |
Non-Aboriginal |
|
|
Metropolitan |
85.2 |
89.6 |
|
Regional |
82.9 |
86.4 |
|
Remote |
77.8 |
91.2 |
|
Total |
81.2 |
90.1 |
Source: Commissioner for Children and Young People WA 2020, Speaking Out Survey 2019 Data Tables [unpublished]
Overall, more than 90 per cent (92.7%) of Year 4 to Year 6 students reported they have access to the internet at home.
|
Male |
Female |
Metropolitan |
Regional |
Remote |
Total |
|
|
I have this |
94.3 |
91.2 |
94.3 |
89.1 |
84.4 |
92.7 |
|
I don’t have this |
4.2 |
5.7 |
3.7 |
7.7 |
10.7 |
4.9 |
|
I don’t have this and I don’t want or need it |
1.6 |
3.2 |
2.0 |
3.2 |
5.0 |
2.4 |
Source: Commissioner for Children and Young People WA 2020, Speaking Out Survey 2019 Data Tables [unpublished]
However, in remote locations, a significantly lower proportion of Year 4 to Year 6 students had access to the internet at home compared to the metropolitan area (84.4% remote compared to 94.3% metropolitan). Remote area students were also more likely than students in other parts of WA to say they don’t have access to the internet at home but would like this (10.7% remote compared to 7.7% regional and 3.7% metropolitan).
Among Aboriginal Year 4 to Year 6 students, 20.6 per cent reported not having access to the internet at home, compared to 6.3 per cent of non-Aboriginal students.
|
Aboriginal |
Non-Aboriginal |
|
|
I have this |
79.4 |
93.7 |
|
I don’t have this but would like it |
14.3 |
4.2 |
|
I don’t have this and I don’t want or need it |
6.3 |
2.1 |
Source: Commissioner for Children and Young People WA 2020, Speaking Out Survey 2019 Data Tables [unpublished]
These measures of financial disadvantage and social exclusion highlight that a substantial proportion of primary school students in WA are experiencing disadvantage on multiple fronts. Many Aboriginal children and children in remote areas of WA are particularly vulnerable to ‘missing out’ and experiencing the downstream effects of poverty and disadvantage including poorer health outcomes and lower levels of engagement in education.
For further information on children’s experiences of disadvantage, the Australian Research Alliance for Children and Youth (ARACY) has developed a child deprivation index based on data from the Longitudinal Study of Australian Children (LSAC). The index uses indicators that ARACY has deemed critical to children and young people’s wellbeing through The Nest action agenda. For more information refer to their paper:
Sollis K 2019, Measuring Child Deprivation and Opportunity in Australia: Applying the Nest framework to develop a measure of deprivation and opportunity for children using the Longitudinal Study of Australian Children, ARACY.
For additional information on a child-centred approach to material deprivation, more broadly, refer:
Saunders P et al 2018, Material Deprivation and Social Exclusion Among Young Australians: A child-focused approach (SPRC Report 24/18), Social Policy Research Centre, UNSW.
The Melbourne Institute of Applied Economic and Social Research calculated material deprivation across different demographic groups using data from the 2014 Household, Income and Labour Dynamics in Australia (HILDA) survey. This study used material deprivation items identified by the Social Policy Research Centre (refer Saunders et al 200713), including items such as being able to afford furniture in reasonable condition, new school clothes for school-age children every year and medical treatment when needed.14
This study found that children under 15 years of age are one of the groups most significantly affected by deprivation with one in 10 children and young people living in households without three or more items. They note this was in part because there are more deprivation items that apply to households with children.15
|
Proportion deprived of |
Proportion deprived of |
|
|
Aboriginal |
40.3 |
21.5 |
|
Lone parent |
29.4 |
19.1 |
|
Disability with severe work restrictions |
25.5 |
16.4 |
|
Unemployed |
24.9 |
14.5 |
|
Under 15 years |
16.2 |
10.1 |
|
Disability with moderate work restrictions |
15.9 |
9.2 |
|
Single non-elderly male |
15.4 |
9.1 |
|
Single non-elderly female |
15.1 |
7.6 |
|
Not in the labour force |
14.5 |
8.5 |
|
15 to 24 years |
14.6 |
8.2 |
Source: Wilkins, The Household, Income and Labour Dynamics in Australia Survey: Selected Findings from Waves 1 to 14, Chapter 8 – Material Deprivation
Note: Not all groups in the analysis are reported above. The above table has been sorted from highest level of deprivation (on 2 or more items) to lowest for the selected groups. Refer to Table 8.3 in Wilkins, Chapter 8 – Material Deprivation for the full list.
In this analysis Aboriginal Australians, single parents and people with disability with severe work restrictions were most likely to experience material deprivation. Of all age groups, children under 15 years of age had the highest proportion (10.1%) of people experiencing material deprivation (deprived of three or more items).
The ABS, National Aboriginal and Torres Strait Islander Social Survey (NATSISS) in 2014–15 reported that 31.5 per cent of Australian Aboriginal children aged four to 14 years lived in a household that ran out of money for basic living expenses.16
Child poverty
While material deprivation is a more suitable approach to measuring children’s experiences of poverty and deprivation, income-based poverty rates still provide important information on the risk of poverty in various populations.17
Measures of poverty are varied and contested. In wealthy countries such as Australia, the internationally accepted practice is to measure poverty by setting a poverty line as a fraction of the median disposable household income.18 Commonly-used poverty line thresholds are either 50.0 or 60.0 per cent of median income.19
Child poverty measures have historically been calculated for children and young people aged 0 to 14 years, referred to as children under 15 years.
In their 2020 Poverty in Australia report, the Australian Council of Social Service (ACOSS) and the University of NSW have used the 50.0 per cent poverty line after housing costs.20 They calculated that in 2017–18, 13.6 per cent of all Australians were in poverty and 17.7 per cent of children under 15 years of age were living in households experiencing poverty.21
Australian children under 15 years of age generally experience the highest poverty rate compared to other age groups in Australia.22
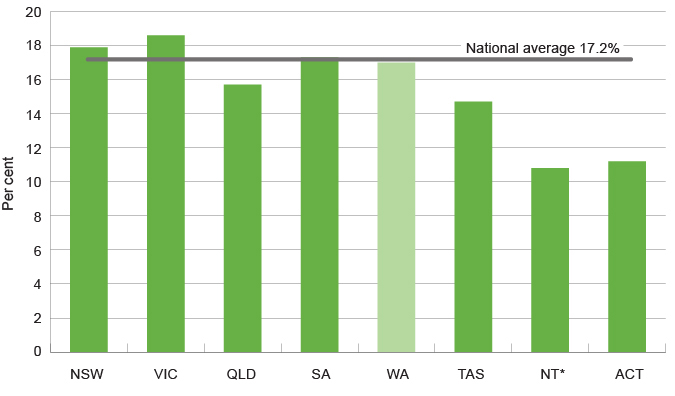
The rate of child poverty differs across the various states and territories in Australia. The National Centre for Social and Economic Modelling (NATSEM) used the same methodology as the ACOSS Poverty Report (50.0% median income after housing costs) to calculate child poverty rates for each Australian jurisdiction in 2016.
Based on this analysis the child poverty rate in WA in 2015–16 was 17.0 per cent, compared to 17.2 per cent Australia-wide.23
|
Per cent |
|
|
NSW |
17.9 |
|
VIC |
18.6 |
|
QLD |
15.7 |
|
SA |
17.3 |
|
WA |
17.0 |
|
TAS |
14.7 |
|
NT* |
10.8 |
|
ACT |
11.2 |
|
Australia |
17.2 |
Source: NATSEM, Child Social Exclusion, Poverty And Disadvantage In Australia
Note: Calculated based on 50 per cent of the Australian median disposable income (after housing costs).
* Northern Territory estimates are mainly representative of urban areas only. Remote and sparsely settled areas are excluded.
Poverty rates for children under 15 years by jurisdiction, per cent, Australia, 2015–16
Source: NATSEM, Child Social Exclusion, Poverty And Disadvantage In Australia
* Northern Territory estimates are mainly representative of urban areas only. Remote and sparsely settled areas are excluded.
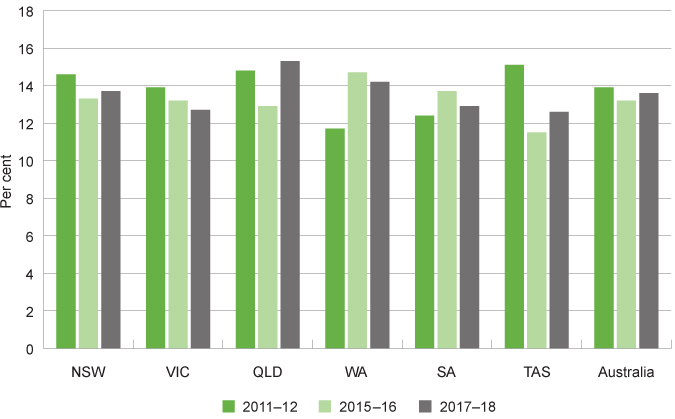
The ACOSS report: Poverty in Australia calculates that the overall poverty rate in WA has reduced from marginally 13.7 per cent in 2015–16 to 12.9 per cent in 2017–18. This is lower than the Australian poverty rate of 13.6 per cent.
|
2011–12 |
2015–16 |
2017–18 |
|
|
NSW |
14.6 |
13.3 |
13.7 |
|
VIC |
13.9 |
13.2 |
12.7 |
|
QLD |
14.8 |
12.9 |
15.3 |
|
SA |
11.7 |
14.7 |
14.2 |
|
WA |
12.4 |
13.7 |
12.9 |
|
TAS |
15.1 |
11.5 |
12.6 |
|
NT |
9.1* |
10.1 |
7.5 |
|
ACT |
9.1* |
7.7 |
8.6 |
|
Australia |
13.9 |
13.2 |
13.6 |
Source: Davidson P et al 2020, Poverty in Australia 2020: Part 1, Overview. ACOSS/UNSW Poverty and Inequality Partnership Report No. 3, ACOSS, Davidson P et al 2018, Poverty in Australia, 2018, ACOSS/UNSW Poverty and Inequality Partnership Report No 2 and Australian Council of Social Services (ACOSS) 2014, Poverty in Australia 2014, ACOSS and the Social Policy Research Centre
Note: Calculated based on 50 per cent of the Australian median disposable income (after housing costs)
* Combined poverty rate for NT and ACT in 2011–12
Poverty rate by jurisdiction (excl. territories), per cent, Australia, 2011–12, 2015–16 and 2017–18
Source: ACOSS Poverty and inequality data and figures: Rate of poverty by state/territory of residence and previous years Poverty in Australia reports
This data suggests that in WA poverty increased from 2011–12 to 2015–16, while it decreased in many other jurisdictions across Australia, and then decreased in WA in 2017–18.
Poverty rates in WA are tied to the economic booms and downturns in the WA economy, in particular, the shifts in median incomes and also changes in the cost of living, including rental costs.24 The increase in poverty in WA in 2015–16 aligns with the end of the mining boom in WA which impacted incomes and costs.
Interestingly, the above analysis uses the Australian median income, not the WA median income. The Bankwest Curtin Economics Centre calculated that in 2013–14 the WA (50.0%) poverty rate was 17.6 per cent using the state median income (which better reflects living standards and costs in WA), compared to 14.1 per cent using the national median income.25
The COVID-19 pandemic is expected to have a significant impact on poverty and social exclusion across WA; this will be reported as data becomes available.
NATSEM calculated child poverty rates using income data from the 2016 Census for ABS Statistical Area Level 2 (SA2) regions across Australia. Their analysis concluded that in 2016 over 60.0 per cent of children (aged 0 to 14 years) were in poverty in East Pilbara, Meekatharra and Roebuck. In contrast, approximately seven per cent of children in Floreat and Swanbourne-Mt Claremont were determined to be in poverty.26
Detailed data is not available to estimate poverty for Aboriginal children in WA, however, those areas with very high poverty have a higher proportion of Aboriginal children than non-Aboriginal children.
A research paper from the Australian National University (ANU) researched the distribution of income within the Australian Aboriginal population, and between the Aboriginal and non-Aboriginal populations. This study used data from the 2016 Census to conclude that 31.4 per cent of Aboriginal Australians were living in poverty (50% median income before housing costs).27 In contrast, to the ACOSS Poverty report which found that the Australian poverty rate was 13.2 per cent in 2015–16 (50% median income after housing costs).28 The ANU report did determine that the proportion of Aboriginal Australians in poverty had decreased from 33.9 per cent in 2006 to 31.4 per cent in 2016. However, this decrease is not evident for Aboriginal Australians in remote and very remote areas, where poverty increased from 2006 to 2016.29
These results confirm the disproportionate experience of poverty of Aboriginal Australians compared to the general population.
For more information on poverty for Aboriginal people in Australia refer to:
Markham F and Biddle N 2018, Income, Poverty and Inequality: 2016 Census Paper No. 2, Centre for Aboriginal Economic Policy Research, Australian National University.
Low-income families
An alternative measure of financial disadvantage is the proportion of children under 15 years of age living in low-income families. These children are less likely to have good nutrition, appropriate housing, heating and medical care and more likely to live in a family experiencing stress, which is detrimental to their overall wellbeing.
The Australian Bureau of Statistics (ABS) reports data on household income by family type sourced from the Survey of Income and Housing (SIH), which is conducted every two years. In this survey, low-income households are defined as households in the lowest equivalised disposable household income quintile, excluding the first and second percentiles (i.e. the 3rd to 20th percentiles inclusive).30
The following data on low-income families in WA is from a custom report provided to the Commissioner for Children and Young People by the ABS using data from the SIH.
|
Couple families |
Single-parent families |
Total |
|||
|
Number |
Per cent* |
Number |
Per cent* |
Number |
|
|
2007–08 |
69,500 |
7.7 |
29,500** |
21.2 |
99,000 |
|
2009–10 |
90,100 |
9.7 |
47,700 |
28.3 |
137,800 |
|
2011–12 |
104,700 |
10.0 |
32,400 |
24.0 |
137,100 |
|
2013–14 |
72,900 |
7.1 |
54,800** |
39.3# |
127,700 |
|
2015–16 |
93,900 |
8.6 |
47,700 |
32.6# |
141,600 |
|
2017–18 |
102,400 |
8.6 |
51,400 |
43.9# |
153,800 |
Source: Australian Bureau of Statistics, custom report derived from the Survey of Income and Housing [unpublished]
Note: Dependent children are all persons aged under 15 years; and persons aged 15 to 24 years who are full-time students, have a parent in the household and do not have a partner or child of their own in the household.
* Proportion of people in this category (e.g. couple family with dependent children) who are in a low-income family.
** Estimate has a relative standard error of 25 per cent to 50 per cent and should be used with caution.
# Proportion has a high margin of error (MoE) and should be used with caution.
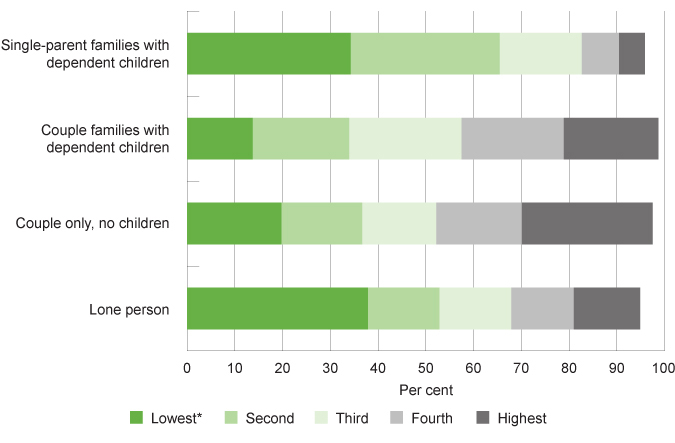
In 2017–18, 43.9 per cent of people in single-parent families with dependent children were living in low-income households (subject to a margin of error of 10.2), compared to only 8.6 per cent of people in couple families with dependent children.31
The proportion of people in single-parent families (usually a mother and children) who are considered low income has increased significantly since 2007–08 (subject to the margin of error). There has been a slight increase for couple families with dependent children, however, much less marked than for the single-parent families.
A higher proportion (43.9%) of WA single-parent families with dependent children are living in low-income families than single-parent families with dependent children across Australia (34.3%).32
|
Lowest* |
Second |
Third |
Fourth |
Highest |
|
|
Single-parent families |
34.3 |
31.2 |
17.2 |
7.8 |
5.4 |
|
Couple families with dependent children |
13.8 |
20.2 |
23.5 |
21.4 |
19.8 |
|
Couple only, no children |
19.8 |
16.9 |
15.5 |
17.9 |
27.4 |
|
Lone person |
37.9 |
15.0 |
15.0 |
13.1 |
13.9 |
Source: Australian Bureau of Statistics, Household Income and Wealth, Australia, 2017–18, Cube 4 – selected characteristics of households and wealth
* The lowest quintile income quintile excludes the first and second percentiles. The 1st and 2nd percentiles are excluded due to the high wealth and expenditure characteristics those household exhibit, and the prevalence of income types other than employee income and government pensions and allowances. As a result, the categories do not sum to 100.
Proportion of family types in equivalised disposable household income quintiles, per cent, Australia, 2017–18
Source: Australian Bureau of Statistics, Household Income and Wealth, Australia, 2017–18, Cube 4 – selected characteristics of households and wealth
* The lowest quintile income quintile excludes the first and second percentiles. The 1st and 2nd percentiles are excluded due to the high wealth and expenditure characteristics those household exhibit, and the prevalence of income types other than employee income and government pensions and allowances. As a result, the categories do not sum to 100.
A significant majority (65.5%) of Australian single-parent families with dependent children were living in households receiving median incomes in the lowest two quintiles (excluding the first and second percentile).
Furthermore, other data shows that just under one-half of single parents (45%) are more likely to be spending more than 30.0 per cent of their gross weekly income on housing.33
Refer to the Homelessness and housing stress measure for more discussion.
Endnotes
- Australian Institute of Health and Welfare (AIHW) 2012, A picture of Australia’s children 2012, Cat no PHE 167, AIHW, p. 70.
- Australian Research Alliance for Children and Youth (ARACY) 2009, Technical Report: The wellbeing of young Australians, ARACY, p. 27.
- Barnett M 2008, Economic Disadvantage in Complex Family Systems: Expansion of Family Stress Models, Clinical child and family psychology review, Vol 11, No 3.
- Machell K et al 2016, Buffering the Negative Impact of Poverty on Youth: The Power of Purpose in Life, Social Indicators Research, Vol 126, No 2.
- Saunders P et al 2018, Material Deprivation and Social Exclusion Among Young Australians: A child-focused approach (SPRC Report 24/18), Social Policy Research Centre, UNSW.
- Australian Bureau of Statistics (ABS) 2018, Fact Sheet: Household Economic Wellbeing – Low economic resource households, ABS.
- Saunders P et al 2007, Towards new indicators of Disadvantage: Deprivation and social exclusion in Australia, Social Policy Research Centre, University of New South Wales, p. vii.
- Saunders P et al 2018, Material Deprivation and Social Exclusion Among Young Australians: A child-focused approach (SPRC Report 24/18), Social Policy Research Centre, UNSW.
- Ibid.
- Shankar P et al 2017, Association of Food Insecurity with Children's Behavioral, Emotional, and Academic Outcomes: A Systematic Review, Journal of Developmental & Behavioral Pediatrics, Vol 38, No 2.
- Thomas M et al 2019, Food Insecurity and Child Health, Pediatrics, Vol 144, No 4.
- Commissioner for Children and Young People WA 2020, Speaking Out Survey 2019 Data Tables, Commissioner for Children and Young People WA [unpublished].
- Saunders P et al 2007, Towards New Indicators of Disadvantage: Deprivation and Social Exclusion in Australia, Social Policy Research Centre, University of New South Wales.
- Saunders P and Wilkins R 2016, The Household, Income and Labour Dynamics in Australia Survey: Selected Findings from Waves 1 to 14, Chapter 8 – Material Deprivation, Melbourne Institute of Applied Economic and Social Research, University of Melbourne, p. 84.
- Ibid, p. 87.
- Australian Bureau of Statistics (ABS) 2016, National Aboriginal and Torres Strait Islander Social Survey (NATSISS): 2014-15, Table 6: Selected characteristics, by remoteness — Children aged 0–3 years — 2008 and 2014–15, ABS.
- Saunders P et al 2018, Material Deprivation and Social Exclusion Among Young Australians: A child-focused approach (SPRC Report 24/18), Social Policy Research Centre, UNSW.
- There has recently been increasing recognition of how wealth interacts with income and that someone with a low income can have high wealth and therefore not be in poverty. Source: Saunders P et al 2007, Towards new indicators of Disadvantage: Deprivation and social exclusion in Australia, Social Policy Research Centre, University of New South Wales, p. 1.This is particularly relevant for older Australians who may have low income and yet own their homes and have other assets.
- Marks G 2007, Social Policy Research Paper No 29: Income poverty, subjective poverty and financial stress, Melbourne Institute of Applied Economic and Social Research, p 2.
- The ACOSS Poverty report 2019 uses data from the ABS Survey of Income and Housing 2017–18 along with data from earlier similar ABS surveys. They have calculated poverty rates from household disposable income after housing costs. They also excluded two population groups from their analysis: all households who report zero or negative disposable incomes; and all self-employed households. Refer to the Research methodology report for further discussion.
- Davidson P et al 2020, Poverty in Australia 2020: Part 1, Overview. ACOSS/UNSW Poverty and Inequality Partnership Report No. 3, ACOSS, p. 9.
- Productivity Commission 2018, Rising inequality? A stocktake of the evidence, Productivity Commission Research Paper, Productivity Commission, p. 121.
- Miranti R et al 2018, Child Social Exclusion, Poverty And Disadvantage In Australia, NATSEM, Institute for Governance and Policy Analysis (IGPA), University of Canberra.
- Bankwest Curtin Economics Centre 2018, THE PRICE IS RIGHT? an Examination of the Cost of Living in Western Australia, Focus on Western Australia Report Series, No.10, December 2017, BCEC, p. viii.
- Ibid, p. 74.
- Miranti R et al 2018, Child Social Exclusion, Poverty And Disadvantage In Australia, NATSEM, Institute for Governance and Policy Analysis (IGPA), University of Canberra.
- Markham F and Biddle N 2018, Income, Poverty and Inequality: 2016 Census Paper No. 2, Centre for Aboriginal Economic Policy Research, Australian National University, p. 16.
- Davidson P et al 2018, Poverty in Australia, 2018, ACOSS/UNSW Poverty and Inequality Partnership Report No 2, ACOSS, p. 22.
- Markham F and Biddle N 2018, Income, Poverty and Inequality: 2016 Census Paper No. 2, Centre for Aboriginal Economic Policy Research, Australian National University, p. 16.
- The first and second percentiles are excluded due to the high wealth and expenditure characteristics those household exhibit, and the prevalence of income types other than employee income and government pensions and allowances.
- The previous report The State of Western Australia’s Children and Young People – Edition Two used analysis from the Australian Bureau of Statistics which excluded the first income decile. The ABS has recently noted that this approach may have over-estimated the economic wellbeing of low income households, and unnecessarily excluded some of the most vulnerable households in the lowest income decile. The 2017–18 SIH uses the adjusted lowest income quintile that was introduced for the 2013–14 SIH cycle. The adjusted lowest income quintile is made up of the lowest two deciles, excluding the first and second percentiles.
- Australian Bureau of Statistics (ABS) 2019, Household Income and Wealth, Australia, 2017–18, Cube 4 – selected characteristics of households and wealth
- Australian Bureau of Statistics (ABS) 2019, 4130.0 - Housing Occupancy and Costs, 2017–18: Summary, ABS.
Last updated December 2019
Social exclusion is not having the capacity and opportunity to engage in activities that are generally seen as part of normal economic and social functioning.1 It is a multi-dimensional concept which is broader than financial disadvantage and material deprivation and considers barriers that lead to exclusion including discrimination, geographic disadvantages and lack of access to services.
Children experience social exclusion when they lack the opportunities and resources to participate fully in their communities, education and health services and to feel connected.2
The National Centre for Social and Economic Modelling (NATSEM) has developed the Child Social Exclusion (CSE) Index for 0 to 14 year-olds which comprises five domains related to social exclusion: socioeconomic circumstances, education, connectedness, housing and health service access.3
NATSEM use the Census and other administrative data including the National Assessment Program – Literacy and Numeracy (NAPLAN) results and the Australian Early Development Census (AEDC) data to determine a CSE Index score for all geographic locations across Australia.
In 2016, 11.4 per cent of WA children aged 0 to 14 years were in the most excluded CSE Index quintile (compared to 20.0 per cent of Australian children).4
|
Per cent of children |
|
|
NSW |
21.7 |
|
VIC |
18.1 |
|
QLD |
20.7 |
|
SA |
26.0 |
|
WA |
11.4 |
|
TAS |
34.1 |
|
NT |
43.1 |
|
ACT |
0.0 |
Source: NATSEM, Child Social Exclusion, Poverty And Disadvantage In Australia
Across all States and Territories (excluding the Australian Capital Territory), WA had the lowest proportion of children in the lowest quintile of social exclusion.
From 2011 to 2016 the researchers determined that across Australia the educational status of families had improved, a greater proportion of parents were undertaking voluntary work, but more families were experiencing housing stress.5 This analysis was not reported by jurisdiction.
There were significant variations across WA regions. A high CSE Index score is a sign of greater disadvantage. In 2016, CSE Index scores were highest in the remote WA regions of Halls Creek (77.79), Leinster-Leonora (71.17), East Pilbara (69.68) and Roebuck (64.41). In the Perth metropolitan area, children living in suburbs including Girrawheen (58.16) and Balga-Mirrabooka (54.95) were at very high risk of experiencing social exclusion.
In stark contrast, children living in suburbs including City Beach (0.33), Floreat (0.49), Swanbourne-Mt Claremont (0.60) and Cottesloe (0.67) were at very low risk of social exclusion.
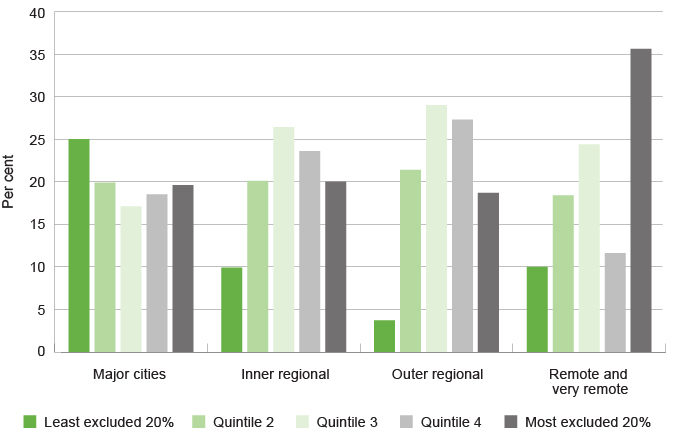
Consistent with these results, while approximately 20.0 per cent of children in metropolitan and regional areas are at a high risk of social exclusion, NATSEM determined that 36.0 per cent of Australian children in remote and very remote areas were facing the highest risk of social exclusion.6
|
Major cities |
Inner regional |
Outer regional |
Remote and very remote |
|
|
Least excluded 20% |
25.0 |
9.9 |
3.7 |
10.0 |
|
Quintile 2 |
19.9 |
20.1 |
21.4 |
18.4 |
|
Quintile 3 |
17.1 |
26.4 |
29.0 |
24.4 |
|
Quintile 4 |
18.5 |
23.6 |
27.3 |
11.6 |
|
Most excluded 20% |
19.6 |
20.0 |
18.7 |
35.6 |
|
Total |
100.0 |
100.0 |
100.0 |
100.0 |
Source: NATSEM, Child Social Exclusion, Poverty And Disadvantage In Australia, Table 4: A Comparison of 2016 CSE Index by Remoteness Area 2016 (% of children)
Proportion of children and young people aged 0 to 14 years in remoteness areas by CSE Index, per cent, Australia, 2016
Source: NATSEM, Child Social Exclusion, Poverty And Disadvantage In Australia, Table 4: A Comparison of 2016 CSE Index by Remoteness Area 2016 (% of children)
Research using the NATSEM CSE Index has shown that Australian children living in areas with a high risk of child social exclusion have, on average, worse health outcomes than children living in other areas.7
This study found that the rate of potentially preventable hospitalisations was 75.0 per cent higher among the 20.0 per cent of Australian children who lived in areas with the highest risk of child social exclusion than among the 20.0 per cent who lived in areas with the lowest risk. This result was statistically significant, while the differences between the other quintiles were not significant.8
Of particular concern, there were more than twice as many avoidable deaths among the 20.0 per cent of children who lived in the areas with the highest risk of child social exclusion than among the 20.0 per cent who lived in the areas with the lowest risk.9
Recognising that living in remote locations is associated with a high risk of social exclusion and poor health outcomes, the hospitalisation analysis was performed excluding remote and very remote areas. The association between social exclusion and potentially preventable hospitalisations was still significant (although not as marked) for non-remote areas.10
Endnotes
- Saunders P et al 2018, Material Deprivation and Social Exclusion Among Young Australians: A child-focused approach (SPRC Report 24/18), Social Policy Research Centre, UNSW Sydney, p. 2.
- Miranti R et al 2018, Child Social Exclusion, Poverty And Disadvantage In Australia, National Centre for Social and Economic Modelling, Institute for Governance and Policy Analysis (IGPA), University of Canberra, p. 4.
- Ibid.
- Ibid.
- Ibid, p. 27.
- Ibid.
- Australian Institute of Health and Welfare (AIHW) 2014, Child social exclusion and health outcomes: a study of small areas across Australia, Bulletin no. 121, Cat No AUS 180, AIHW.
- Ibid, p. 6.
- Australian Institute of Health and Welfare (AIHW) 2014, Child social exclusion and health outcomes: a study of small areas across Australia, Bulletin no. 121, Cat No AUS 180, AIHW.
- Ibid.
Last updated August 2020
Homelessness and housing instability have both immediate and longer-term effects on children’s health and wellbeing. Research indicates childhood experiences of homelessness may affect physical health, educational attainment and social functioning.1,2,3 It is also linked to homelessness in adulthood.4
Housing stress can be experienced when a family is experiencing housing instability due to high housing costs, is living in low-quality housing, is experiencing overcrowding or has been subject to multiple house moves.5
Ensuring children have a stable home by improving housing affordability is critical to reducing rates of deprivation and poverty and therefore improving the long term outcomes for many children in WA.6
Homelessness for children and young people occurs through the following pathways:7
- being part of a homeless family (usually due to poverty or intergenerational homelessness)
- leaving the family home with one parent (usually with the mother to escape violence or abuse)
- leaving the family home independently (often to escape violence or abuse in the home)
- exiting care or the youth justice system.
Children who are homeless will generally be part of a homeless family or with a parent escaping violence; while older children and young people may be living independently.
The Australian Institute of Health and Welfare (AIHW) manages the Specialist Homelessness Services Collection (SHSC) which collects data about people who are receiving support from specialist homelessness services funded by the Australian Government and State and Territory governments.
This collection captures different data from the Census as it does not necessarily include people who are living in severely overcrowded dwellings but can include people who are at risk of homelessness if they are receiving support from homelessness services. Furthermore, this collection provides information on the number of people accessing a service during a year, while the Census seeks to report the number of people experiencing homelessness at a point in time.
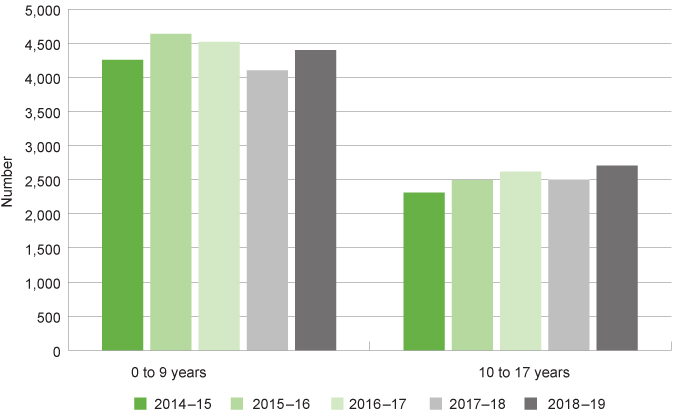
In 2018–19, 4,397 children aged 0 to nine years presented at WA specialist homelessness services (with their families). The number of WA children aged 0 to nine years presenting to specialist homelessness services (with their families) has fluctuated since 2014–15.
|
0 to 9 years |
10 to 14 years |
15 to 17 years |
Total |
|
|
2014−15 |
4,255 |
1,248 |
1,061 |
6,564 |
|
2015−16 |
4,637 |
1,387 |
1,104 |
7,129 |
|
2016−17 |
4,520 |
1,421 |
1,197 |
7,138 |
|
2017−18 |
4,100 |
1,343 |
1,156 |
6,599 |
|
2018−19 |
4,397 |
1,534 |
1,172 |
7,103 |
Source: AIHW, Specialist Homelessness Services Collection data cubes 2011–19, SHSC Demographics data cube
Note: The age groups (0 to 9 and 10 to 14 and 15 to 17 years) do not have an equal number of year groups, therefore the numbers are not directly comparable.
Number of children and young people presented to specialist homelessness services by age group, number, WA, 2014–15 to 2018–19
Source: AIHW, Specialist Homelessness Services Collection data cubes 2011–19, SHSC Geographical Location of client
Note: The age groups (0 to 9 and 10 to 17 years) do not have an equal number of year groups, therefore the numbers are not directly comparable.
A greater number of young children (aged 0 to 9 years) present to WA specialist homelessness services (with their families) than children and young people older than 10 years of age.
Similar numbers of male and female children aged 0 to 14 years present to homelessness services (male: 2,997; female: 2,934).8 In contrast, for young people aged 15 to 17 years the proportion of female clients was greater than that of male clients (61.7% female compared to 38.3% male).9 This marks the beginning of the trend where women are more likely to seek assistance from specialist homelessness services than men,10 with the increase being particularly related to experiences of family and domestic violence.
Aboriginal children and young people across all age groups are disproportionately impacted by homelessness: 57.4 per cent of all children aged 0 to nine years presenting to homelessness services are Aboriginal, while Aboriginal children and young people comprise only 6.8 per cent of the total WA population of children and young people.11
|
Aboriginal |
Non-Aboriginal |
Total |
|||
|
0 to 9 years |
2,525 |
57.4 |
1,700 |
38.7 |
4,397 |
|
10 to 14 years |
767 |
50.0 |
702 |
45.8 |
1,534 |
|
15 to 17 years |
532 |
45.4 |
596 |
50.9 |
1,172 |
Source: AIHW, Specialist Homelessness Services Collection data cubes 2011–19, SHSC Demographics data cube
Note:
- The age groups do not have an equal number of years.
- Total includes children and young people with unstated Aboriginal status.
The Census is a key measure of homelessness in Australia.
The Australian Bureau of Statistics (ABS) defines a person as homeless if they do not have suitable accommodation alternatives and their current living arrangement: is in a dwelling that is inadequate; has no tenure, or if their initial tenure is short and not extendable; or does not allow them to have control of, and access to space for social relations.12 This definition was introduced by the ABS in 2011 and incorporates a concept of severe overcrowding, contrary to the traditional definition of homelessness.13 The Census differs from the Specialist Homelessness Services data as it reports on living conditions at a point in time as opposed to those receiving homelessness services during the year.
In 2016, there were 1,208 WA children aged 0 to 11 years who were reported as homeless.
|
2011 |
2016 |
|
|
Male |
767 |
636 |
|
Female |
724 |
576 |
|
Total |
1,491 |
1,208 |
Source: ABS, 2011 and 2016, Census of Population and Housing: Estimating homelessness, Table 4.6 Homeless Operational Groups and Other Marginal Housing, WA–Sex by age of person–2016
The number of WA children aged 0 to 11 years reported as homeless in the census decreased from 2011 to 2016.
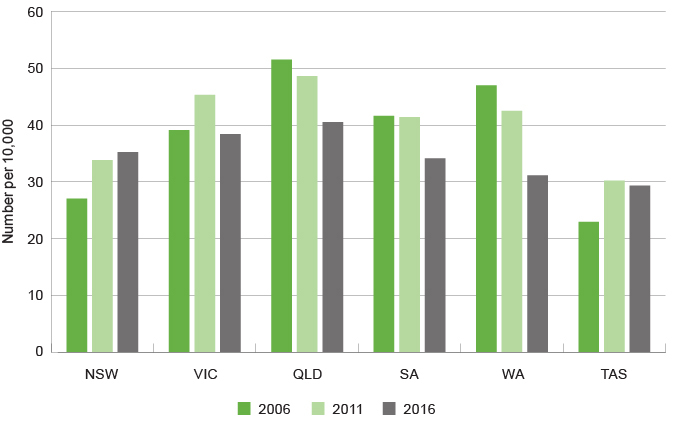
In 2016, the WA rate of homelessness for children aged 0 to 11 years was lower than in most other states and territories, except Tasmania and the ACT.
|
2006 |
2011 |
2016 |
|
|
NSW |
27.0 |
33.8 |
35.2 |
|
VIC |
39.1 |
45.3 |
38.4 |
|
QLD |
51.5 |
48.6 |
40.5 |
|
SA |
41.6 |
41.4 |
34.1 |
|
WA |
47.0 |
42.5 |
31.1 |
|
TAS |
22.9 |
30.2 |
29.3 |
|
NT |
1049.5 |
1046.5 |
771.9 |
|
ACT |
29.0 |
53.5 |
29.7 |
|
Australia |
50.5 |
53.6 |
44.8 |
Source: Census of Population and Housing: Estimating homelessness, 2016, Table 1.5 State and Territory of Usual Residence, Rate of homeless persons per 10,000 of the population, by selected characteristics, 2001, 2006, 2011 and 2016
Rate of homeless children aged 0 to 11 years by jurisdiction (excl. NT and ACT), number per 10,000 of population, Australia, 2006 to 2016
Source: Census of Population and Housing: Estimating homelessness, 2016, Table 1.5 State and Territory of Usual Residence, Rate of homeless persons per 10,000 of the population, by selected characteristics, 2001, 2006, 2011 and 2016
The rate of homelessness for WA children aged 0 to 11 years has reduced from 47.0 per 10,000 population in 2006 to 31.1 per 10,000 population in 2016. This was a significant reduction compared to other jurisdictions around Australia.
Geographic distribution of homelessness
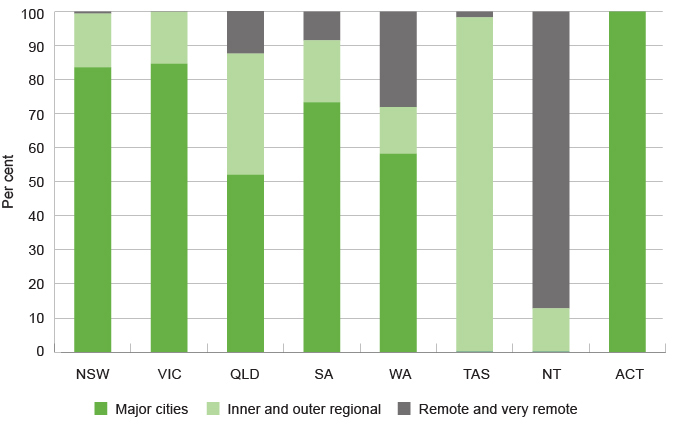
In comparison to all other Australian jurisdictions (except the Northern Territory), a larger proportion (6.0%) of WA people live in remote and very remote areas.14 This influences the geographic structure of homelessness in WA, such that a high proportion (28.1%) of WA people who are homeless live in remote and very remote areas.
|
Major cities |
Inner and outer |
Remote |
|
|
NSW |
83.6 |
15.8 |
0.6 |
|
VIC* |
84.6 |
15.3 |
0.1 |
|
QLD |
52.0 |
35.6 |
12.5 |
|
SA |
73.3 |
18.2 |
8.5 |
|
WA |
58.2 |
13.7 |
28.1 |
|
TAS* |
0.0 |
98.3 |
1.7 |
|
NT* |
0.0 |
12.8 |
87.2 |
|
ACT |
100.0 |
0.0 |
0.0 |
|
Australia |
64.6 |
19.9 |
15.5 |
Source: Australian Bureau of Statistics, Census of Population and Housing: Estimating homelessness, 2016, Table 7.1 Homeless Operational Groups and Other Marginal Housing, Remoteness Areas by State and Territory of place of enumeration
* The Australian Statistical Geography Standard (ASGS) defines remoteness areas into five classes of relative remoteness across Australia using a combination of population sizes (to define urban centres) and distances from urban centres. This table combines remote and very remote and inner and outer regional. In this classification, Hobart and Darwin are not major cities and Victoria does not have very remote locations. Refer to 1270.0.55.005 - Australian Statistical Geography Standard (ASGS): Volume 5 - Remoteness Structure, July 2016 for more information.
Proportion of people who are homeless by jurisdiction and remoteness area, per cent, Australia, 2016
Source: Australian Bureau of Statistics, Census of Population and Housing: Estimating homelessness, 2016, Table 7.1 Homeless Operational Groups and Other Marginal Housing, Remoteness Areas by State and Territory of place of enumeration
The majority of people who are homeless in WA live either in the metropolitan area (58.2%) or in very remote areas (21.2%).
WA children and young people aged 0 to 14 years living in remote and very remote areas were seven times more likely to be homeless than those living in outer regional areas (2.1% compared to 0.3% respectively) and 10 times more likely to be homeless than those living in the metropolitan area (2.1% compared to 0.2% respectively).15
Of the people in WA who are homeless and living in a very remote location, 72.0 per cent are considered homeless as a result of severe overcrowding. In contrast, of the 58.2 per cent of WA people who are homeless in the Perth metropolitan area, only 37.7 per cent are homeless as a result of severe overcrowding.16
Over 60 per cent of people who are homeless in the Pilbara and Kimberley are in severely overcrowded dwellings.17
Aboriginal people in WA are 25 times more likely to be living in severely overcrowded dwellings than non-Aboriginal people (233.8 per 10,000 compared to 9.2 per 10,000).18 This is associated with the relatively high number of Aboriginal people living in remote WA locations.
The majority (71.2%) of WA children aged 0 to 11 years who were categorised as homeless in 2016 lived in severely overcrowded dwellings.
|
0 to 11 years |
12 to 18 years |
|||
|
Number |
Per cent |
Number |
Per cent |
|
|
Improvised dwellings, tents or sleeping out |
68 |
5.6 |
45 |
6.1 |
|
Supported accommodation for the homeless |
146 |
12.1 |
121 |
16.3 |
|
Temporarily staying with other households |
129 |
10.7 |
68 |
9.2 |
|
Boarding houses |
13 |
1.1 |
18 |
2.4 |
|
Severely crowded dwellings* |
860 |
71.2 |
496 |
66.9 |
|
Total |
1,208 |
100.0 |
741 |
100.0 |
Source: ABS, 2016, Census of Population and Housing: Estimating homelessness, Table 4.6 Homeless operational groups and other marginal housing, WA –Sex by age of person–2016
* People living in severely crowded dwellings are living in a dwelling which requires four or more extra bedrooms to accommodate the people who usually live there, as defined by the Canadian National Occupancy Standard (CNOS). ABS, 2012, Fact Sheet: Overcrowding.
Overcrowding limits people’s access to basic amenities which are necessary for health, including washing, laundry, hygienic food storage and preparation, and safe disposal of waste.19 Overcrowding can also increase the risk of family violence, child abuse and neglect.20,21,22
As WA Aboriginal children are more likely to live in overcrowded circumstances they are more likely to experience poor health and wellbeing outcomes.23
Main reasons for seeking homelessness assistance
The Specialist Homelessness Services Collections gathers data on clients’ reasons for seeking assistance at the start of their support period. The majority of people attending homelessness services in WA in 2018–19 were attending due to domestic and family violence.
|
Male |
Female |
Total |
||||
|
Number |
Per cent |
Number |
Per cent |
Number |
Per cent |
|
|
Family and domestic violence |
1,736 |
18.8 |
6,263 |
40.0 |
7,999 |
32.2 |
|
Financial difficulties |
1,993 |
21.6 |
2,473 |
15.8 |
4,466 |
18.0 |
|
Housing crisis |
998 |
10.8 |
1,292 |
8.3 |
2,290 |
9.2 |
|
Inadequate or inappropriate dwelling conditions |
817 |
8.9 |
899 |
5.7 |
1,716 |
6.9 |
Source: AIHW, Specialist Homelessness Services Collection data cubes 2011–19, SHSC Demographics data cube
Note: The above table reports on all clients including children. 1,604 (92.4%) of the males seeking assistance due to domestic and family violence were children compared to (1,719) 27.4 per cent of the females.
WA women are more likely to seek assistance from specialist homelessness services than men (67.5% of adult clients are female).24 Almost forty per cent (37.9%) of adult females in WA seeking assistance from specialist homelessness services cited family and domestic violence as the main reason for presenting to homelessness services.
It should be noted that the main reason quoted will usually not be the only reason; people seeking assistance for homelessness are often experiencing multiple and intersecting difficulties such as leaving violence, family breakdown, financial difficulties, drug and alcohol issues and legal disputes.25,26
The single most common reason for children and young people seeking assistance is family and domestic violence.
|
0 to 9 years |
10 to 14 years |
15 to 17 years |
Total |
|
|
Domestic and family violence |
2,468 |
614 |
241 |
3,323 |
|
Other* |
559 |
284 |
139 |
982 |
|
Housing crisis |
299 |
118 |
99 |
516 |
|
Relationship/family breakdown |
139 |
99 |
175 |
413 |
|
Inadequate or inappropriate dwelling conditions |
170 |
85 |
133 |
388 |
|
Time out from family/other situation |
182 |
65 |
79 |
326 |
|
Financial difficulties |
130 |
43 |
43 |
216 |
Source: AIHW, Specialist Homelessness Services Collection data cubes 2011–19, SHSC Demographics data cube
* There is no breakdown of Other by age group, however, the other category includes ‘Lack of family and/or community support’, ‘Itinerant’, ‘Transfer from custodial arrangements’ and ‘Unable to return home due to environmental reasons’.
In 2018–19, a total of 2,468 WA children aged 0 to 9 years sought assistance from specialist homelessness services due to family and domestic violence. This represents almost 56.1 per cent of the total number (4,397) of WA children seeking assistance in this age group. This reduces to 40.0 per cent of children and young people aged 10 to 14 years.
Family and domestic violence is one of the key drivers of homelessness for women and children.27 Research has found that there is a lack of secure, affordable and permanent housing to provide women and children leaving violence with safe, long-term housing. Family and domestic violence victims therefore sometimes decide to remain in, or return to, a violent relationship because of the lack of available and appropriate housing.28
For more information on WA children’s experiences of family and domestic violence refer to the Safe in the home indicator.
Housing stress
Housing affordability and availability has a significant impact on families and young people’s ability to live securely and safely. Research shows that housing stress and instability can have a detrimental effect on children and young people’s health and wellbeing in the short term and over the longer term.29,30
A household living with housing stress is defined as a household that spends more than 30.0 per cent of their income on housing costs.31 Based on data from the 2016 Census 21.3 per cent of WA children aged 0 to 14 years live in a household experiencing housing stress. This is a slight reduction from 2011 (23.2%), but still higher than the proportion in 2006 (17.5%).32
Although housing prices have reduced since the end of the mining boom, in 2019 Perth still ranked as the least affordable city in Australia for renters with typical housing cost shares around 27.0 per cent of disposable income.33 The risk of poverty is more than twice as high for households renting privately than home-owners, with or without a mortgage.34
Almost one-half of WA single parents who live in rented accommodation survive on low incomes and commit at least 30.0 per cent of their income towards housing costs.35
The WA state government has a number of mechanisms available to improve housing affordability including increasing social housing, subsidising private rentals, providing low deposit housing loans through Keystart and increasing affordable housing lots to increase general housing stock.
Social housing is rental housing provided by the state and territory governments and community sectors and is available for those people who are unable to access suitable accommodation in the private rental market. In WA it includes public housing, community housing and Indigenous community housing.
In recent years the supply of social housing has not kept pace with demand.36 The stock of social housing dwellings in WA has not increased substantially since 2014.
|
2014 |
2015 |
2016 |
2017 |
2018 |
2019 |
|
|
Public housing |
33,467 |
33,361 |
33,533 |
33,836 |
33,293 |
32,905 |
|
Community housing |
6,967 |
6,776 |
7,409 |
7,847 |
8,062 |
7,968 |
|
Indigenous community housing |
2,493 |
2,575 |
2,670 |
2,649 |
2,704 |
N/A |
|
Total |
42,927 |
42,712 |
43,612 |
44,332 |
44,059 |
N/A |
Source: Productivity Commission, Report on Government Services 2020, Housing - Table 18A.3 Number of social housing dwellings, at 30 June
N/A – not published
The average waiting times for public rental housing in WA reduced from 158 weeks in 2014–15 to 95 weeks in 2018–19. The median waiting time in 2018–19 was 45 weeks, a reduction from 125 weeks in 2014–15.37
While the reduction in waiting times is encouraging, 45 weeks is still almost one year to wait for public housing.
At 30 June 2018, there were 6,892 applicants on the public housing wait list who were under the age of 18 years.38
|
30 June 2016 |
30 June 2017 |
30 June 2018 |
|
|
Number of applications |
18,530 |
16,516 |
13,912 |
|
Total number of applicants |
36,167 |
29,544 |
23,637 |
|
Number of applicants under 18 |
11,963 |
9,070 |
6,892 |
|
Applicants under 18 (% of total) |
33.1 |
30.7 |
29.2 |
Source: Department of Communities (Housing) 2018, data as at 30 June 2016, 2017 and 2018, custom report [unpublished]
Despite a significant reduction in the number of applicants under 18 years of age over the last two years from 11,963 to 6,892, children and young people continue to represent a significant proportion of 29.1 per cent of all applicants on the public housing list.
Demand for social housing differs across the WA metropolitan area and regions.
The Department of Communities calculated demand for social housing across local government areas (LGAs) in WA using data from the 2016 Census. This analysis estimated that the WA metropolitan LGAs with the highest unmet demand for social housing and high projected population growth included Armadale (unmet demand of approximately 1,000 houses), Wanneroo (unmet demand of approximately 1,750 houses) and Swan (unmet demand of approximately 1,300 houses).39
For non-metropolitan areas, the LGAs of Busselton (unmet demand of approximately 640 houses), Greater Geraldton (unmet demand of approximately 690 houses) and Broome (unmet demand of approximately 400 houses) had the highest unmet demand for social housing and high projected population growth.40
For more information on homelessness, housing affordability and housing stress refer to the following resources:
Anglicare WA 2019, Rental Affordability Snapshot 2019 – Western Australia, Anglicare.
Bland D and Shallcross L 2015, Children who are homeless with their family: A literature review, Commissioner for Children and Young People WA.
Kaleveld L et al 2019, Ending Homelessness in Western Australia 2019 Report, The Western Australian Alliance to End Homelessness Annual Snapshot Report Series, The University of Western Australia, Centre for Social Impact.
Endnotes
- Noble-Carr D 2007, The Experiences and Effects of Family Homelessness for Children: A Literature Review, Institute of Child Protection Studies, Australian Catholic University.
- Cobb-Clarke D et al 2016, A journey home: What drives how long people are homeless?, Journal of Urban Economics, Vol 91.
- Sandel M et al 2018, Unstable Housing and Caregiver and Child Health in Renter Families, Pediatrics, Vol 141, No 2.
- Flatau P et al 2013, Lifetime and intergenerational experiences of homelessness in Australia, AHURI Final Report No 200, Australian Housing and Urban Research Institute, p. 2-3.
- Sandel M et al 2018, Unstable Housing and Caregiver and Child Health in Renter Families, Pediatrics, Vol 141, No 2.
- Bankwest Curtin Economics Centre (BCEC) 2018, THE PRICE IS RIGHT? an Examination of the Cost of Living in Western Australia, Focus on Western Australia Report Series, No.10, December 2017, BCEC, p. 66.
- Kaleveld L et al 2018, Homelessness in Western Australia: A review of the research and statistical evidence, WA Government, Department of Communities, p. 30.
- Australian Institute of Health and Welfare (AIHW) 2020, Specialist Homelessness Services Collection data cubes 2011–19, SHSC Demographics data cube, AIHW.
- Australian Institute of Health and Welfare (AIHW) 2020, Specialist Homelessness Services Collection data cubes 2011–19, SHSC Demographics data cube, AIHW.
- Australian Institute of Health and Welfare (AIHW) 2019, Specialist homelessness services 2017–18, Table WA CLIENTS.1: Clients and support periods, by age and sex, 2017–18.
- Commissioner for Children and Young People WA 2020, Profile of Western Australia’s Children and Young People, Commissioner for Children and Young People WA.
- Australian Bureau of Statistics (ABS) 2018, Explanatory Notes: Definitions of Homelessness. ABS.
- Kaleveld L et al 2018, Homelessness in Western Australia: A review of the research and statistical evidence, WA Government, Department of Communities, p. 7.
- Australian Bureau of Statistics (ABS) 2019, 3218.0 - Regional Population Growth, Australia, 2017-18, Population Estimates by Remoteness Area (ASGS 2016), 2008 to 2018.
- Australian Institute of Health and Welfare (AIHW) 2019, Children’s Headline Indictors: Homelessness, AIHW.
- Australian Bureau of Statistics (ABS) 2018, Census of Population and Housing: Estimating homelessness, 2016, Table 7.1 Homeless Operational Groups and Other Marginal Housing, Remoteness Areas by State and Territory of place of enumeration, ABS.
- Australian Bureau of Statistics (ABS) 2018, Census of Population and Housing: Estimating homelessness, 2016, Table 5.1 Homeless Operational Groups and Other Marginal Housing, by place of enumeration, Statistical Area Level 3 and 4, ABS.
- Australian Bureau of Statistics (ABS) 2018, Census of Population and Housing: Estimating homelessness, 2016, Table 1.7 State and Territory of Usual Residence, Rate of homeless persons per 10,000 of the population, Homeless operational groups by selected characteristics, ABS.
- Flatau P et al 2018, The State of Homelessness in Australia’s Cities: A Health and Social Cost Too High, Centre for Social Impact, The University of Western Australia, p. 33.
- Cant R et al 2019, Overcrowded housing: One of a constellation of vulnerabilities for child sexual abuse, Child Abuse & Neglect, Vol 93.
- Parkinson S et al 2017, Child Neglect: Key concepts and risk factors – A report to the NSW Department of Family and Community Services Office of the Senior Practitioner, Australian Centre for Child Protection, p. 36.
- DiNicola K et al 2019, Out of the Shadows: Domestic and family violence – a leading cause of homelessness in Australia, Mission Australia, p. 29.
- Flatau P et al 2018, The State of Homelessness in Australia’s Cities: A Health and Social Cost Too High, Centre for Social Impact, The University of Western Australia, p. 33.
- Australian Institute of Health and Welfare (AIHW) 2020, Specialist homelessness services 2018–19, Demographics data cube.
- Wood L 2019, Safe as Houses Evaluation Report, School of Population and Global Health: University of Western Australia, p. 1.
- Australian Government 2008, The Road Home: A National Approach to Reducing Homelessness, Australian Government, p. 24.
- Australian Government 2008, The Road Home: A National Approach to Reducing Homelessness, Australian Government, p. 7.
- Flanagan K et al 2019, Housing outcomes after domestic and family violence, AHURI Final Report 311, Australian Housing and Urban Research Institute Limited, p. 4, 56.
- Wood L 2016, What are the health, social and economic benefits of providing public housing and support to formerly homeless people?, AHURI Final Report No.265, Australian Housing and Urban Research Institute, p. 12.
- Dockery M et al 2014, What impact does a child’s housing have on their development and wellbeing?, AHURI Research and Policy Bulletin, No 171.
- Australian Institute of Health and Welfare (AIHW) 2018, Children’s Headline Indicators - Housing Stress, AIHW.
- Ibid.
- Duncan A et al 2019, Getting Our House In Order: BCEC Housing Affordability Report 2019, Bankwest Curtin Economics Centre, Focus on Western Australia Series, Issue #12, p. x.
- WA Council of Social Services (WACOSS) 2019, Cost of Living 2018, WACOSS, p. 36.
- Duncan A et al 2019, Getting Our House In Order: BCEC Housing Affordability Report 2019, Bankwest Curtin Economics Centre, Focus on Western Australia Series, Issue #12, p. x.
- Australian Institute of Health and Welfare (AIHW) 2019, Housing Assistance in Australia 2019, AIHW.
- WA Department of Communities 2019, Housing Authority Annual Report: 2018-19, WA Government.
- Children and young people under 18 are considered applicants when their parent(s) or guardians are applying for housing to accommodate them. In a small number of cases the young person (aged 16 to 17 years) can be applying in their own right.
- Considine J and Mewett S 2017, Estimating unmet housing demand and priority areas for public and affordable housing at the Local Government Area level – a housing practitioner’s approach, Department of Communities, WA Government.
- Ibid.
Last updated August 2020
At 30 June 2019, there were 1,618 WA children in care aged between five and nine years, more than one-half of whom (55.1%) were Aboriginal.1
In general, children in care have experienced significant adverse events on an ongoing basis. These may include neglect, exposure to family violence and alcohol and drug use, food scarcity and physical or sexual abuse.2
Research has highlighted that neglect is closely associated with families experiencing poverty and social exclusion, although not all parents in poverty are neglectful and not all children who are neglected come from financially disadvantaged families.3
Emotional abuse (53.2%) and neglect (26.9%) are the most common reasons for WA children and young people to be subject to substantiations of notifications.
|
Number |
Per cent |
|
|
Emotional* |
2,508 |
53.2 |
|
Neglect** |
1,271 |
26.9 |
|
Physical |
503 |
10.7 |
|
Sexual |
412 |
8.7 |
|
Not stated |
23 |
0.5 |
|
Total |
4,717 |
100.0 |
Source: AIHW 2020, Child Protection Australia: 2018–19, Table S3.5: Children who were the subjects of substantiations of notifications received during 2018–19 by type of abuse or neglect, sex and state or territory
* Emotional abuse refers to any act by a person having the care of a child that results in the child suffering any kind of significant emotional deprivation or trauma. Children affected by exposure to family violence are also included in this category (Source: AIHW, Child Protection Australia Glossary).
** Neglect refers to any serious act or omission by a person having the care of a child that, within the bounds of cultural tradition, constitutes a failure to provide conditions that are essential for the healthy physical and emotional development of a child (Source: AIHW, Child Protection Australia Glossary).
Children and young people living in low socioeconomic areas have the highest risk of being the subject of a child protection substantiation compared with children living in other more advantaged areas.
|
Aboriginal |
Non-Aboriginal |
Total |
|
|
1 - Lowest |
41.8 |
31.6 |
34.7 |
|
2 |
28.4 |
23.0 |
24.3 |
|
3 |
14.7 |
23.8 |
21.3 |
|
4 |
11.4 |
14.3 |
13.4 |
|
5 - Highest |
3.6 |
7.2 |
6.3 |
Source: AIHW 2020, Child Protection Australia: 2018–19, Table S3.8: Children who were the subjects of substantiations, by socioeconomic area and Indigenous status, 2018–19
In Australia in 2017–18, 41.8 per cent of Aboriginal children who were the subjects of substantiations were living in low socioeconomic areas. This compares to 31.6 per cent of non-Aboriginal children.
Children in care, or at risk of being taken into care, are more likely to have experienced housing instability and homelessness than other children.
The majority of children and young people who have been under care and protection orders and engaging with homelessness services are under 10 years of age. In 2018–19, 471 WA children aged 0 to nine years were on child protection orders and had also accessed homelessness services. This represents more than one-half (60.3%) of the all WA children and young people who received both child protection services and homelessness services.
The rate of occurrence has also increased from 2.6 per 10,000 children and young people (aged 0 to 17 years) in 2017–18 to 3.0 per 10,000 children and young people in 2018–19.
|
2015–16 |
2016–17 |
2017–18 |
2018–19 |
|
|
0 to 9 years |
360 |
393 |
390 |
471 |
|
10 to 14 years |
119 |
125 |
112 |
143 |
|
15 to 17 years |
143 |
176 |
175 |
159 |
|
Total number |
637 |
706 |
683 |
781 |
|
Total clients per 10,000 ERP* |
2.5 |
2.8 |
2.6 |
3.0 |
Source: AIHW, Specialist Homelessness Services Collection data cubes 2011–19, SHSC Demographics data cube and Table CPO.2: Children with a care and protection order, by state and territory, 2018–19 (and previous years tables)
* Estimated resident population for age group
International research shows that housing is a significant issue for children and young people in contact with the child protection system; homelessness and housing instability can influence child removal, delay reunification with family and generally adversely impact child wellbeing.6 In families experiencing housing instability and homelessness, recurrent episodes of homelessness increase the likelihood of involvement with the child protection system.7
Other key aspects of coming into and being in care are experiences of transience, lack of stability and contact with multiple service providers. Typically, children would have been removed from the family home and transferred into another home, either family care (kinship care), a foster care placement or residential care.
Stable care placements tend to deliver better learning and psycho-social outcomes for affected children than experiences of ongoing episodes of instability.8 Placement instability can have significant adverse effects on young people including attachment issues and a lack of safe and supportive relationships, which can lead to poor educational, socio-emotional and behavioural outcomes.9
For more information on the placement stability of children in out-of-home refer to the Safe in the home indicator.
Endnotes
- Department of Communities 2019, Annual Report: 2018-19, WA Government p. 26.
- Delfabbro P et al 2009, The social and family backgrounds of infants in care and their capacity to predict subsequent abuse notifications: a study of South Australian out-of-home care 2000-2005, Children and Youth Services Review, Vol 31, p. 219-226.
- Scott D 2014, Understanding Child Neglect, CFCA Paper No 20, Child Family Community Australia, Australian Institute of Family Studies.
- Australian Institute of Health and Welfare (AIHW) 2019, Specialist homelessness services annual report 2017–18 – Children on care and protection orders, AIHW.
- Australian Institute of Health and Welfare (AIHW) 2019, Specialist homelessness services annual report 2017–18 – Children on care and protection orders, AIHW.
- White R 2017, Understanding the Nexus of Child Welfare and Housing in America, in LaLiberte T et al (Eds), CW360º The Impact of Housing and Homelessness on Child Wellbeing, Center for Advanced Studies in Child Welfare (CASCW), University of Minnesota.
- Greenburg M and Tackney M 2017, Exploring the Intersections between Child Welfare, Housing, and Homelessness: Current Research, Policy, and Practice, in LaLiberte T et al (Eds), CW360º The Impact of Housing and Homelessness on Child Wellbeing, Center for Advanced Studies in Child Welfare (CASCW), University of Minnesota.
- Australian Institute of Health and Welfare (AIHW) 2019, National framework for protecting Australia's children indicators – 4.2 Placement stability, AIHW.
- Australian Institute of Family Studies 2018, CFCA Resource Sheet – Children in care, AIHW.
Last updated August 2020
The Australian Bureau of Statistics Disability, Ageing and Carers, 2018 data collection reports that approximately 30,200 WA children and young people (9.2%) aged five to 14 years have reported disability.1,2
Disability is more common among children living with socioeconomic disadvantage.
In 2003, almost one-fifth (18.0%) of Australian families living in areas of the greatest socioeconomic disadvantage (the first decile) had a child with disability, compared to 13.0 per cent of all families.3
The relationship between socioeconomic disadvantage and disability is complex and bi-directional. Families living with financial disadvantage and social exclusion are more likely to have a child with disability, while having a disability or caring for a child with disability can lead to financial disadvantage.
Socioeconomic disadvantage is a risk factor for disability due to multiple intersecting elements including poorer access to quality antenatal care and childhood health services, inadequate nutrition and a higher risk of maternal smoking and alcohol consumption during pregnancy.4,5,6
People with disability are also more likely to have lower incomes.7
Caring for a child with disability impacts a parents and/or carers ability to earn an income. In the 2018 Disability, Ageing and Carers survey, primary carers were less likely to report wages or salary as their main source of personal income (44.0%) than other carers (62.0%). The labour force participation rate for primary carers (55.5%) was also significantly lower than that for non-carers (77.4%).8
Single-parent families are more likely to have a child with disability compared to couple families. Research shows that couples with a child with disability are more likely to separate than those who do not have a child with disability.9,10
About one in five (19.0%) one-parent families with children aged 0 to 14 years had a child with disability, and 10 per cent had a child with profound/severe disability. In contrast, about one in ten (11.0%) couple families with children of this age had a child with disability and six per cent had a child with profound/severe disability.11
This issue disproportionately affects women. In 2018, 96.0 per cent of Australian primary carers (aged 25 to 44 years) of a child with disability were women.
|
Male |
Female |
||||
|
Number |
Per cent |
Number |
Per cent |
Total |
|
|
15 to 24 years |
0* |
0.0* |
1,200* |
63.2* |
1,900* |
|
25 to 44 years |
6,400 |
6.2 |
99,800 |
96.0 |
104,000 |
|
45 to 64 years |
15,800 |
15.5 |
88,300 |
86.4 |
102,200 |
Source: Australian Bureau of Statistics, Disability, Ageing and Carers, Australia, 2018: Carers Tables – Table 34.1 Primary carers, relationship of carer to main recipient of care, by age and sex of primary carers–2018, estimate
* Estimate has a relative standard error of 25% to 50% and should be used with caution
Note: The totals do not sum as cells have been randomly adjusted to avoid the release of confidential data.
Recent research has found that Australians with disability are more likely to experience housing disadvantage including homelessness, poor-quality housing and housing unaffordability. The researchers concluded that 11.2 per cent of Australians with disability were living in unaffordable housing compared to 7.6 per cent of people without disability.12
People with physical disability, including children, can require housing that has modifications to accommodate physical disabilities; therefore appropriate affordable housing is more difficult to access, particularly for low-income families.
There is however very limited up-to-date information on children with disability and how this impacts parents’ ability to secure affordable and appropriate housing.
There is no recent data on WA children with disability and their experience of financial disadvantage, social exclusion and/or housing stress and homelessness.
In 2019, the Commissioner conducted the Speaking Out Survey which sought the views of a broadly representative sample of Year 4 to Year 12 students in WA on factors influencing their wellbeing.13 The survey included young people in Year 7 to Year 12 with disability. For responses from these students regarding material basics refer to the Material basics indicator for 12 to 17 years.
Endnotes
- The ABS uses the following definition of disability: ‘In the context of health experience, the International Classification of Functioning, Disability and Health (ICFDH) defines disability as an umbrella term for impairments, activity limitations and participation restrictions… In this survey, a person has a disability if they report they have a limitation, restriction or impairment, which has lasted, or is likely to last, for at least six months and restricts everyday activities.’ Australian Bureau of Statistics 2016, Disability, Ageing and Carers, Australia, 2015, Glossary.
- Australian Bureau of Statistics 2020, Disability, Ageing and Carers, Australia, 2018, Western Australia, Table 1.1 Persons with disability, by age and sex, estimate, and Table 1.3 Persons with disability, by age and sex, proportion of persons.
- Australian Bureau of Statistics 2008, Australian Social Trends: Families with a young child with a disability, ABS.
- Australian Bureau of Statistics 2008, Australian Social Trends: Families with a young child with a disability, ABS.
- Australian Institute of Health and Welfare (AIHW) 2009, The geography of disability and economic disadvantage in Australian capital cities, Cat no DIS 54, AIHW.
- Centre for Community Child Health 2009, The Impact of Poverty on Early Childhood Development, The Royal Children’s Hospital Melbourne.
- Australian Bureau of Statistics (ABS) 2016, A profile of people with disability in Australia, ABS.
- Australian Bureau of Statistics 2020, Disability, Ageing and Carers, Australia, 2018, Table 32.3 Persons aged 15 years and over, living in households, carer status, by selected economic and social characteristics–2018, ABS.
- Clarke H and McKay S 2008, Exploring disability, family formation and break-up: Reviewing the evidence, Research Report No 514, Department for Work and Pensions, p. 5.
- Reichman NE et al 2004, Effects of child health on parents’ relationship status, Demography, Vol 41.
- Australian Bureau of Statistics 2008, Australian Social Trends: Families with a young child with a disability, ABS.
- Aitken Z et al 2019, Precariously placed: housing affordability, quality and satisfaction of Australians with disabilities, Disability and Society, Vol 34, No 1.
- Commissioner for Children and Young People WA 2020, Speaking Out Survey: The views of WA children and young people on their wellbeing - a summary report, Commissioner for Children and Young People WA.
Last updated August 2020
While most WA children are doing well, a significant proportion of WA children experience material disadvantage that can result in poorer health and wellbeing outcomes.
Social and economic disadvantage can significantly constrain children’s development and wellbeing and may be due to family unemployment, family dysfunction (including through family violence, mental health issues or drug and alcohol misuse), a lack of suitable and affordable housing, illness or disability, and discrimination.1,2 This can then manifest in social exclusion and inequality, which in turn limits access to high-quality child care, health care, schooling and employment opportunities.3,4
Financial disadvantage, social exclusion and housing stress and homelessness all contribute to children having less capacity to engage in learning, have less access to good health care and experience stress in childhood that can lead to socio-emotional and behavioural difficulties.5,6
Improving the health and wellbeing of children in the early years has been named a key priority by the WA Government.7 One of the most effective ways to achieve this will be to reduce the rate of children living with financial disadvantage and social exclusion. Regular monitoring and reporting on a measure of child poverty measure is an essential component of meeting this goal and should be a priority for the WA and Commonwealth governments.
Welfare policies have a significant impact on poverty, particularly for children. Fifty‑three per cent of people below the (50.0%) poverty line rely on social security for their main source of income.8
Changes to the eligibility criteria for the Parenting Payment combined with the lack of increase to the Newstart Allowance (now Jobseeker Payment) since 1994 have contributed to both an increase and deepening of child poverty over the last 15 years.9 In particular, single parents (often mothers) who are reliant on income support for a significant component of their income are more likely to be in poverty. ACOSS report that the risk of poverty for Australian children in single-parent families was three times that of children in couple families (39.0% compared with 13.0% based on the 50.0% poverty line).10
The recent introduction of the JobSeeker Payment (to replace Newstart allowance) and the Coronavirus supplement as part of the Commonwealth government response to the COVID-19 pandemic are expected to have temporarily reduced financial hardship for many Australians, however the impacts of increasing unemployment due to the pandemic are expected to significantly increase poverty and disadvantage over the longer term.
Government departments and service providers need to assess the impact of proposed laws and policies and their programs on the rights and wellbeing of children. The WA and Commonwealth governments should develop a process of performing Child Impact Assessments when passing legislation or developing policy, programs and services. This will provide a greater understanding of how government policies, including welfare policies, impact children. For more information refer to the Commissioner’s report:
Commissioner for Children and Young People 2020, Child Impact Assessment Guidelines, Commissioner for Children and Young People WA.
Aboriginal children are disproportionately affected across all areas of disadvantage. Research using data from the 2016 Census has concluded that in 2016, 31.4 per cent of Aboriginal Australians were living in poverty (50% median income before housing costs).11
Aboriginal people living in remote locations are most likely to be living in poverty and/or be socially excluded through limited access to appropriate housing, health services and education. In 2016, more than one-half of Aboriginal people in very remote locations were living in income poverty.12
Research from the Australian Institute of Health and Welfare (AIHW) has shown that children living in families with members of the stolen generation are even more likely to be socially excluded, including being more likely to miss school, experience stress and have poor health.13
The continuing overrepresentation of Aboriginal children across all indicators of disadvantage calls for immediate and more effective ways of working to address the underpinning issues and significantly improve the wellbeing of Aboriginal children across the state.
Importantly, services and programs must address Aboriginal children’s needs in the context of their family, community and culture. To do this the government should commit to enabling Aboriginal-led solutions as the model for service design and delivery for Aboriginal communities in WA.
Access to stable and safe housing and accommodation is critical to addressing the long-term disadvantage facing many WA children. Without a secure and affordable home, families are unable to provide an environment for their children to feel safe, be able to learn and be healthy. A stable and affordable home is also the first essential step to enable parents to gain employment and financial independence.
Children who first experience homelessness at a young age are more likely to experience persistent homelessness in adulthood. This has an adverse impact on the individual’s wellbeing, livelihood, and life opportunities, and results in significant costs to the government over the long term due to higher health needs, higher likelihood of reliance on welfare payments and increased likelihood of contact with the justice system.14
Families at risk of homelessness are often experiencing multiple and intersecting difficulties such as leaving violence, family breakdown, financial difficulties, drug and alcohol issues and legal disputes.15,16 However, there are two key drivers that ought to be the focus of any policy effort addressing homelessness for children and families more broadly: poverty and domestic violence.
Extreme poverty is the strongest predictor of homelessness in families.17 At the same time, almost one-half (46.8%) of all children and young people presenting to homelessness services report family and domestic violence as the main reason.18
Safe, affordable and permanent housing in WA is essential to assist women and children leaving violence. Research from the Australian Housing and Urban Research Institute (AHURI) reported that refuges in WA are always full and ‘struggling with capacity’.19 Family and domestic violence victims therefore sometimes decide to remain in, or return to, a violent relationship because of the lack of available and appropriate housing.20
Critically, housing and homelessness services, policies, and legislation must be designed in a child-centred way, placing the needs of children at the centre of service planning. Where children are escaping violence with their families, it is critical that long term housing options are available with appropriate wrap-around support services.
To address socioeconomic disadvantage more broadly, the WA Government should establish a Child Wellbeing Strategy, with a priority on targeted, early intervention for vulnerable WA children and their families. For more information refer to the Commissioner’s report: Improving the Odds for WA’s vulnerable children and young people.
Data gaps
Child poverty is a critical issue and yet there is no agreed national definition of child poverty, it is also not measured on a regular basis by any government department – state or federal.
Further data and research is needed on poverty and social exclusion experienced by vulnerable groups, such as Aboriginal children, CALD children and LGBTI children.
Endnotes
- McLachlan R et al 2013, Deep and Persistent Disadvantage in Australia, Productivity Commission Staff Working Paper.
- Australian Government 2009, A Stronger, Fairer Australia, Social Inclusion Unit, Department of Prime Minister and Cabinet
- Duncan A et al 2014, Falling through the cracks: poverty and disadvantage in Australia, Focus on the States Report Series No.1, Bankwest Curtin Economics Centre.
- Australian Government 2009, A Stronger, Fairer Australia, Social Inclusion Unit, Department of Prime Minister and Cabinet
- Australian Research Alliance for Children and Youth (ARACY) 2009, Technical Report: The wellbeing of young Australians, ARACY, p. 27.
- Barnett M 2008, Economic Disadvantage in Complex Family Systems: Expansion of Family Stress Models, Clinical child and family psychology review, Vol 11, No 3.
- Department of Premier and Cabinet 2019, Our Priorities, WA Government.
- Davidson P et al 2018, Poverty in Australia, 2018, ACOSS/UNSW Poverty and Inequality Partnership Report No 2, p. 12.
- Ibid, p. 13.
- Ibid, p. 24.
- Markham F and Biddle N 2018, Income, Poverty and Inequality: 2016 Census Paper No. 2, Centre for Aboriginal Economic Policy Research, Australian National University, p. 16.
- Ibid, p. 33.
- Australian Institute of Health and Welfare (AIHW) 2019, Children living in households with members of the Stolen Generations, Cat no IHW 214, AIHW, p. iv.
- MacKenzie D et al 2016, The Cost of Youth Homelessness in Australia: Research Briefing, Swinburne University of Technology et al, p. 2-3.
- Wood L 2019, Safe as Houses Evaluation Report, School of Population and Global Health: University of Western Australia, p. 1.
- Australian Government 2008, The Road Home: A National Approach to Reducing Homelessness, Australian Government, p. 24.
- Kaleveld L et al 2018, Homelessness in Western Australia: A review of the research and statistical evidence, Government of Western Australia, Department of Communities, p. 31.
- Australian Institute of Health and Welfare (AIHW) 2020, Specialist Homelessness Services Collection data cubes 2011–19, SHSC Demographics data cube, AIHW.
- Flanagan K et al 2019, Housing outcomes after domestic and family violence, Australian Housing and Urban Research Institute Limited (AHURI) Final Report 311, AHURI, p. 53.
- Ibid, p. 4.
For more information on children’s access to material basics refer to the following resources:
- Bland D and Shallcross L 2015, Children who are homeless with their family: A literature review, Commissioner for Children and Young People WA and Queensland University of Technology.
- Commissioner for Children and Young People 2019, Improving the odds for WA’s vulnerable children and young people, Commissioner for Children and Young People WA.
- Kaleveld L et al 2019, Ending Homelessness in Western Australia 2019 Report, The Western Australian Alliance to End Homelessness Annual Snapshot Report Series, The University of Western Australia, Centre for Social Impact.
- Markham F and Biddle N 2018, Income, Poverty and Inequality: 2016 Census Paper No. 2, Centre for Aboriginal Economic Policy Research, Australian National University.
- Saunders P et al 2018, Material Deprivation and Social Exclusion Among Young Australians: A child-focused approach (SPRC Report 24/18), Social Policy Research Centre.
- Sollis K 2019, Measuring Child Deprivation and Opportunity in Australia: Applying the Nest framework to develop a measure of deprivation and opportunity for children using the Longitudinal Study of Australian Children, ARACY.
Endnotes
- Australian Institute of Health and Welfare (AIHW) 2018, Australia’s health 2018, Australia’s health series no 16, AUS 221, AIHW.
- Saunders P et al 2018, Material Deprivation and Social Exclusion Among Young Australians: A child-focused approach (SPRC Report 24/18), Social Policy Research Centre, UNSW.
- Barnett M 2008, Economic Disadvantage in Complex Family Systems: Expansion of Family Stress Models, Clinical child and family psychology review, Vol 11, No 3.