


Safe in the community

Feeling safe and secure is a critical foundation for young people’s healthy development. Feeling safe in their neighbourhood and other communities or groups is essential for young people to develop their independence, engage in physical activity outside their home and build positive relationships with other adults and peers.1,2
Young people who feel unsafe in their community are more likely to experience negative long-term outcomes including anxiety-related disorders, alcohol and drug misuse and behavioural difficulties.3,4
Last updated August 2020
Some data is available on whether WA young people aged 12 to 17 years feel safe, or are safe, in their community.
Overview
This indicator intends to collect data on whether WA young people feel safe in their communities and how many WA young people have experienced violence or abuse in their community, including negative online experiences.
Areas of concern
Only 24.6 per cent of Year 7 to Year 12 students feel safe in their local area all the time.
Almost 40.0 per cent (38.3%) of WA female young people in Year 7 to Year 12 feel safe in their local area only sometimes or less and more than one-half (56.2%) of female students feel safe on buses and trains sometimes or less.
Of the students reporting they had been hit or physically harmed, female students were most likely to be physically harmed at home with almost three-quarters of respondents (72.5%) saying this. Male students on the other hand were most likely to be physically harmed at school (57.4%).
WA young women aged 15 to 19 years are 9.8 times more likely than WA male young people in that age group to be reported as victims of sexual assault.
Almost 20 per cent (16.9%) of Year 7 to Year 12 students in WA reported they had been cyberbullied by students at their school, with a higher proportion of female students being cyberbullied (20.9%) than male students (12.2%).
Other measures
Young people are at risk of accidental injury and death. While children from 0 to five years are at the highest risk of injury and poisoning, young people aged 12 to 17 years also have a high rate of injuries.1 A measure on child deaths or injuries has not been selected for the Indicators of wellbeing as data is regularly compiled by Kidsafe WA and the WA Ombudsman.
For information on child deaths refer to the Ombudsman’s annual Child Death Review. For information on injuries for children refer to Kidsafe WA Childhood Injury Bulletins & Reports.
Endnotes
- Sherlock E et al 2018, Kidsafe WA Childhood Injury Bulletin: Annual Report 2017-2018, Kidsafe WA (AUS).
Last updated August 2020
Communities have a significant influence on young people’s lives. Safe and cohesive communities can improve young people’s wellbeing and help them thrive.1,2
Healthy communities promote positive connections between families and young people through social and recreational resources that improve social cohesion, encourage physical activity and build relationships between adults and young people.3 If young people do not feel safe in their communities this can lead to difficulties forming positive and trusting relationships, mental health issues and behavioural problems.4,5
How community is defined is not clear-cut; community often refers to the local neighbourhood, however, it can also include online communities, faith-based communities, sporting or activity-based communities and school communities. Adult perceptions of whether communities feel safe and supportive may not reflect those of the young people in that community.6
In 2019, the Commissioner for Children and Young People (the Commissioner) conducted the Speaking Out Survey which sought the views of a broadly representative sample of 4,912 Year 4 to Year 12 students in WA on factors influencing their wellbeing, including a range of questions about feeling safe in their local area.
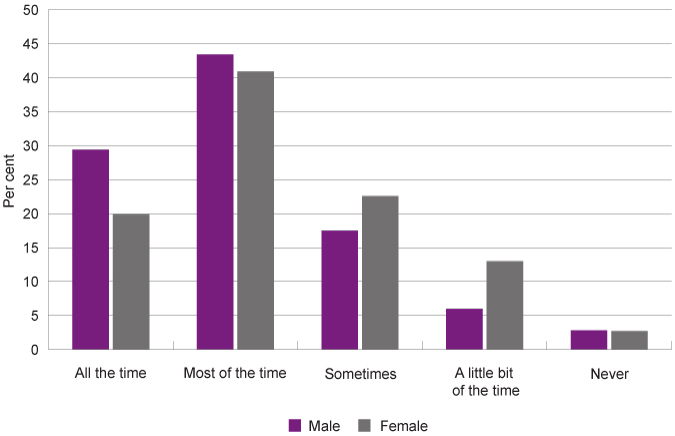
One quarter (24.6%) of Year 7 to Year 12 students reported they feel safe in their local area all the time, while 42.0 per cent reported they feel safe most of the time and one-third (32.5%) feel safe only sometimes or less.
|
Male |
Female |
Metropolitan |
Regional |
Remote |
All |
|
|
All the time |
29.4 |
19.9 |
24.2 |
26.1 |
26.9 |
24.6 |
|
Most of the time |
43.4 |
40.9 |
42.0 |
41.4 |
44.0 |
42.0 |
|
Sometimes |
17.5 |
22.6 |
20.1 |
19.0 |
21.2 |
20.0 |
|
A little bit of the time |
6.0 |
13.0 |
9.7 |
8.8 |
5.7 |
9.4 |
|
Never |
2.8 |
2.7 |
3.1 |
3.3 |
1.7 |
3.1 |
|
Prefer not to say |
N/A |
0.4 |
0.4 |
N/A |
N/A |
0.4 |
|
Does not apply to me |
0.6 |
0.5 |
0.4 |
1.1 |
N/A |
0.5 |
Source: Commissioner for Children and Young People WA 2020, Speaking Out Survey 2019 Data Tables [unpublished]
N/A – Cells are suppressed where the number of students providing data for that response was less than 5.
Female students report feeling safe less often than male students. A significantly lower proportion of female young people than male young people in Year 7 to Year 12 reported they felt safe in their local area all the time (19.9% compared to 29.4%). Almost 40.0 per cent (38.3%) of female young people feel safe in their local area only sometimes or less (26.3% for male young people).
Proportion of Year 7 to Year 12 students reporting they feel safe in their local area all of the time, most of the time, sometimes, a little bit of the time, never or prefer not to say by gender, per cent, WA, 2019
Source: Commissioner for Children and Young People WA 2020, Speaking Out Survey 2019 Data Tables [unpublished]
A higher proportion of Aboriginal than non-Aboriginal students in Year 7 to Year 12 reported feeling safe in their local area all the time (33.7% compared to 24.1%). Non-Aboriginal students were more likely than Aboriginal students to say they feel safe most of the time (42.5% compared to 32.9%). Largely equal proportions of Aboriginal and non-Aboriginal students feel safe only sometimes or less (31.0% compared to 32.4%).
|
Aboriginal |
Non-Aboriginal |
|
|
All the time |
33.7 |
24.1 |
|
Most of the time |
32.9 |
42.5 |
|
Sometimes |
18.7 |
20.0 |
|
A little bit of the time |
8.9 |
9.4 |
|
Never |
3.4 |
3.0 |
|
Prefer not to say |
N/A |
0.4 |
Source: Commissioner for Children and Young People WA 2020, Speaking Out Survey 2019 Data Tables [unpublished]
N/A – Cells are suppressed where the number of students providing data for that response was less than 5.
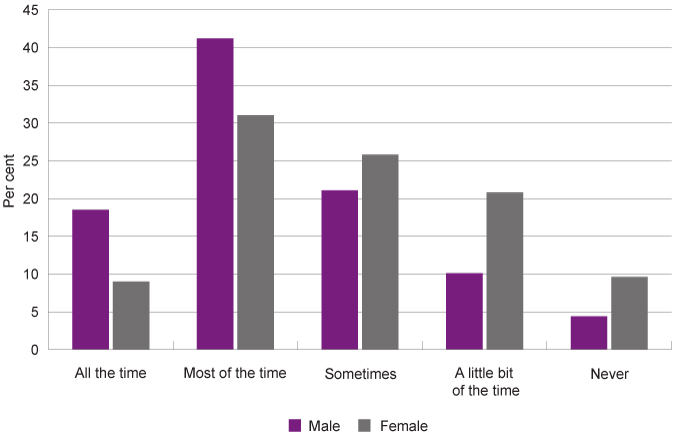
Only 13.8 per cent of students reported they feel safe on buses or trains all the time, while 36.0 per cent reported they feel safe most of the time. One-quarter of students (23.5%) felt safe only sometimes, 15.4 per cent a little bit of the time and 7.1 per cent said they never felt safe.
|
Male |
Female |
Metropolitan |
Regional |
Remote |
All |
|
|
All the time |
18.5 |
9.0 |
13.0 |
16.5 |
19.5 |
13.8 |
|
Most of the time |
41.2 |
31.0 |
36.9 |
31.5 |
33.5 |
36.0 |
|
Sometimes |
21.1 |
25.8 |
23.4 |
26.2 |
18.0 |
23.5 |
|
A little bit of the time |
10.1 |
20.8 |
16.6 |
10.9 |
9.3 |
15.4 |
|
Never |
4.4 |
9.6 |
6.9 |
7.2 |
9.8 |
7.1 |
|
Prefer not to say |
0.5 |
0.5 |
0.6 |
N/A |
N/A |
0.5 |
|
Does not apply to me |
4.2 |
3.2 |
2.7 |
7.3 |
9.6 |
3.7 |
Source: Commissioner for Children and Young People WA 2020, Speaking Out Survey 2019 Data Tables [unpublished]
Of particular concern, less than 10.0 per cent (9.0%) of female Year 7 to Year 12 students reported they feel safe on buses and trains all the time (compared to 18.5% of male students). More than one-half (56.2%) of female students reported that they feel safe on buses and trains sometimes or less (compared to 35.6% of male students).
Proportion of Year 7 to Year 12 students reporting they feel safe on buses or trains all of the time, most of the time, sometimes, a little bit of the time, never or prefer not to say by gender, per cent, WA, 2019
Source: Commissioner for Children and Young People WA 2020, Speaking Out Survey 2019 Data Tables [unpublished]
Over one-third (38.3%) of WA Year 7 to Year 12 students agree a lot that their neighbours are friendly, while one quarter (26.0%) agree a bit that their neighbours are friendly. A significant proportion (22.5%) neither agree nor disagree that their neighbours are friendly, while 13.3 per cent disagree (a bit: 6.9%, a lot: 6.4%).7
Female Year 7 to Year 12 students were less likely than male students to agree a lot or a bit that their neighbours are friendly (62.4% compared to 66.9%). This is a shift from primary school, where a higher proportion of female students than male students in Year 4 to Year 6 agreed their neighbours were friendly (76.9% compared to 72.6%).8
Similar responses were reported regarding neighbours by young people across geographical regions and by Aboriginal and non-Aboriginal young people.
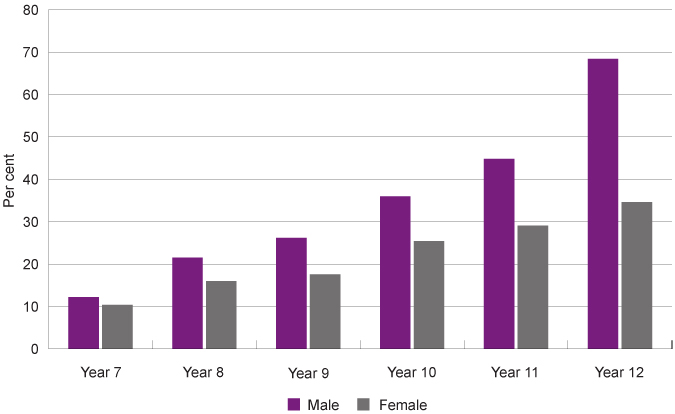
While female young people aged 12 to 17 years were less likely to feel safe in their local area, they were also significantly less likely to be allowed to go out alone at night (21.8% of female students and 33.6% of male students).
The difference between male and female students being allowed to go out at night increased as young people aged. In Year 12, only one-third (34.6%) of female students were allowed to go out alone at night, while more than two-thirds (68.4%) of male students were allowed to go out alone at night.
|
Male |
Female |
|
|
Year 7 |
12.2 |
10.4 |
|
Year 8 |
21.5 |
16.0 |
|
Year 9 |
26.2 |
17.6 |
|
Year 10 |
36.0 |
25.4 |
|
Year 11 |
44.8 |
29.1 |
|
Year 12 |
68.4 |
34.6 |
Source: Commissioner for Children and Young People WA 2020, Speaking Out Survey 2019 Data Tables [unpublished]
Proportion of Year 7 to Year 12 students reporting they were allowed to go out alone at night in their local area by year group and gender, per cent, WA, 2019
Source: Commissioner for Children and Young People WA 2020, Speaking Out Survey 2019 Data Tables [unpublished]
These results highlight that female young people are more likely to feel unable to do all the activities that male young people do, therefore they are less likely to be able to access the same opportunities as their male peers.9
In the annual Mission Australia 2019 Youth Survey, 25,126 Australian young people aged 15 to 19 years responded to questions across a broad range of topics including education and employment, participation in community activities, general wellbeing, values and concerns and preferred sources of support.
The 2019 sample included 2,766 young people from WA.10 One-half of WA respondents (50.3%) were male and 45.8 per cent were female with remainder choosing either ‘other or ‘preferred not to say’. Aboriginal and/or Torres Strait Islander young people comprised 5.9 per cent of WA respondents.11
In this survey, respondents were asked to rate how concerned they were about a number of issues. Almost one-fifth (18.7%) of WA respondents were extremely or very concerned about personal safety. This was consistent with the result for all Australian young people (17.8%).
|
WA |
Australia |
|
|
Not at all concerned |
44.8 |
44.5 |
|
Slightly concerned |
19.1 |
20.0 |
|
Somewhat concerned |
17.4 |
17.8 |
|
Very concerned |
10.4 |
10.6 |
|
Extremely concerned |
8.3 |
7.2 |
Source: Mission Australia, Youth Survey Report 2019
There were significant differences between how male and female young people felt about safety. While 51.7 per cent of WA male respondents were not at all concerned about personal safety, only 37.4 per cent of WA female respondents said the same.
|
Male |
Female |
|
|
Not at all concerned |
51.7 |
37.4 |
|
Slightly concerned |
19.5 |
19.5 |
|
Somewhat concerned |
15.8 |
18.9 |
|
Very concerned |
7.4 |
13.8 |
|
Extremely concerned |
5.5 |
10.4 |
Source: Mission Australia, Youth Survey Report 2019
The Mission Australia report Gender gaps: Findings from the Youth Survey 2018 states that Australian young women aged 15 to 19 years are less likely than young men to trust people in their local area (35.0% compared to 42.1%). It also reports that more than double the proportion of female young people feel unsafe or very unsafe walking alone after dark in their community (46.6% of female young people compared to 18.1% of male young people).12
These results are relatively consistent with the findings from the Speaking Out Survey 2019.
The Australian Bureau of Statistics (ABS) regularly conducts the Personal Safety Survey (PSS) which collects information from men and women aged 18 years and over about the nature and extent of violence experienced since the age of 15 years.
Respondents to the PSS were asked about whether they feel safe in their community. Consistent with the Speaking Out Survey results for young people, WA female respondents (aged 18 years and over) were much more likely to feel unsafe in their local community than male respondents.
|
Male |
Female |
|
|
Used public transport and felt safe |
31.5 |
14.2 |
|
Did not use public transport because felt unsafe |
1.7 |
19.3 |
|
Walked alone and felt safe |
58.3 |
27.5 |
|
Did not walk alone because felt unsafe |
3.8 |
27.7 |
Source: ABS, Personal Safety Survey: 2016, Table 5.1 – Feelings of General Safety in the last 12 months – WA
Note: Public transport includes buses, trains, trams, taxis, and ferries. Local area is defined as the neighbourhood or suburb close to home.
While only 3.8 per cent of WA men did not walk alone at night because they felt unsafe, 27.7 per cent of WA women did not walk alone at night because they felt unsafe.
Data from the ABS 2014–15 National Aboriginal and Torres Strait Islander Social Survey (NATSISS) records feelings of safety and neighbourhood problems for Aboriginal peoples across Australia. In this survey, 70.2 per cent of male Aboriginal young people aged 15 to 24 years feel safe or very safe when walking alone in the local area after dark, while only 34.6 per cent of female Aboriginal young people aged 15 to 24 years feel safe or very safe under these circumstances.13 The NATSISS survey does not provide jurisdictional level data and no data on children and young people’s experiences of violence.14
Lesbian, gay, bisexual, transgender and intersex (LGBTI)15 young people are also at an increased risk of feeling unsafe in their community. Survey research in 2010 has reported that a large proportion (35.0%) of Australian LGBTI young people described receiving verbal and physical abuse in the street, although this had reduced from prior years’ studies (47.0% in 2004 and 45.0% in 1998).16
Institutions also form part of the community and the Royal Commission into Institutional Responses to Child Sexual Abuse (the Royal Commission) has highlighted that many institutions have failed to protect children and young people.
The Royal Commission has highlighted that children and young people are highly vulnerable to abuse perpetrated by a wide range of people associated with institutions, including staff, professionals, families, carers and other children. Furthermore, some children and young people are more vulnerable than others, such as those with disability, those in residential settings and those who have previously been abused.
The Institute of Child Protection Studies was commissioned by the Royal Commission to develop an understanding of how children and young people perceive safety and consider it within institutional contexts.17 An online survey was completed by 1,480 Australian children and young people aged 10 to 18 years.18 The following were key findings:19
- The most influential characteristic in determining how safe children and young people felt within an institution was whether adults pay attention when a child or young person raised a concern or worry.
- If children and young people encounter an unsafe adult or peer they need another adult to believe them when they raised their concern and to step in and take control.
- The most significant barrier to seeking support at school was feeling uncomfortable talking to adults about sensitive issues.
Endnotes
- Child Family Community Australia and NAPCAN 2016, Stronger Communities, Safer Children: Findings from recent Australian research on the importance of community in keeping children safe, Australian Institute of Family Studies.
- Eastman C et al 2014, Thriving in Adversity: A positive deviance study of safe communities for children (SPRC Report 30/2014), Social Policy Research Centre, UNSW Australia.
- Ibid.
- Ibid.
- Kersten L et al 2017, Community Violence Exposure and Conduct Problems in Children and Adolescents with Conduct Disorder and Healthy Controls, frontiers in Behavioural Neuroscience, Vol 11.
- Child Family Community Australia and NAPCAN 2016, Stronger Communities, Safer Children: Findings from recent Australian research on the importance of community in keeping children safe, Australian Institute of Family Studies.
- Commissioner for Children and Young People WA 2020, Speaking Out Survey 2019 Data Tables, Commissioner for Children and Young People WA [unpublished].
- Commissioner for Children and Young People WA 2020, Speaking Out Survey 2019 Data Tables, Commissioner for Children and Young People WA [unpublished].
- Hall S et al 2019, Gender gaps: Findings from the Youth Survey 2018, Mission Australia, p. 4.
- Carlisle E et al 2019, Youth Survey Report 2019, Mission Australia, p. 192. Note: Mission Australia recommend caution when interpreting and generalising the results for certain states or territories because of the small sample sizes and the imbalance between the number of young females and males participating in the survey.
- Ibid, p. 192.
- Hall S et al 2019, Gender gaps: Findings from the Youth Survey 2018, Mission Australia, p. 20.
- Australian Bureau of Statistics (ABS) 2016, 4714.0 - National Aboriginal and Torres Strait Islander Social Survey, 2014-15, Table 15.3 Safety, law and justice, by sex, age and remoteness, Aboriginal and Torres Strait Islander persons aged 15 years and over — 2014–15, Proportion of persons, ABS.
- Australian Bureau of Statistics (ABS) 2016, 4714.0 - National Aboriginal and Torres Strait Islander Social Survey, 2014-15, ABS.
- The Commissioner for Children and Young People understands there are a range of terms and definitions that people use to define their gender or sexuality. The Commissioner’s office will use the broad term LGBTI to inclusively refer to all people who are lesbian, gay, bisexual, trans and intersex, as well as to represent other members of the community that use different terms to describe their diverse sexuality and/or gender.
- Hillier L et al 2010, Writing Themselves in 3: The third national study on the sexual health and wellbeing of same sex attracted and gender questioning young people, Australian Research Centre in Sex, Health and Society, La Trobe University, p. 46.
- Moore T et al 2016, Our safety counts: Children and young people’s perceptions of safety and institutional responses to their safety concerns, Institute of Child Protection Studies, Australian Catholic University.
- The survey was not designed to be representative, however, provides an indication of what children and young people need to feel safe in institutions.
- Moore T et al 2016, Our safety counts: Children and young people’s perceptions of safety and institutional responses to their safety concerns, Institute of Child Protection Studies, Australian Catholic University, p. 8-9.
Last updated August 2020
This measure reports on negative online experiences and is included within this indicator recognising that young people can increasingly access the internet and social media at any time and place.
The vast majority of Australian families have access to the internet, with 97.1 per cent of households with children under the age of 15 reporting having an internet connection at home.1
The Commissioner for Children and Young People’s 2019 Speaking Out Survey found that the majority (88.9%) of WA high school students have their own mobile phone.
Ninety five per cent (95.6%) of Year 10 to Year 12 students have their own mobile phone, compared to 86.3 per cent of Year 7 to Year 9 students. Female students in Year 7 to Year 9 are more likely to have a mobile phone than male Year 7 to Year 9 students (88.7% compared to 83.9%). In Years 10 to 12 there is no significant difference between the proportion of male and female students having their own mobile phone.2
A greater proportion of young people in the metropolitan area than regional and remote areas had their own mobile phone (metropolitan: 91.6%, regional: 85.9%, remote: 88.5%).3
In 2018, the Australian Communications and Media Authority conducted an online survey to explore how children and young people aged six to 13 years use their mobile phones.4 For young people aged 12 to 13 years, they found the most common uses for mobile phones was to send or receive texts (79.0%), to take photos and videos (77.0%), to use apps (76.0%), to take and receive calls from parents and family (74.0%) and to listen to music (73.0%) and play games (72.0%).5
In 2017, the Australian eSafety Commissioner conducted the Digital Participation Survey with more than 3,000 young people in Australia aged 8 to 17 years and collected information on their online safety experiences and behaviours. In this survey the most common social media services used by young people aged 13 to 17 years were YouTube (86.0%), Facebook (75.0%), Instagram (70.0%) and Snapchat (67.0%).6
Most young people are more connected to technology than ever before and while this presents them with valuable opportunities for developing a sense of social connection and belonging, it also makes young people more vulnerable to having negative online experiences. Negative online experiences can include unwanted contact from strangers, being sent unwanted material such as sexual material and exclusion from social groups as well as bullying.
Negative online experiences are varied and can often, although not always, involve a form of cyberbullying. Cyberbullying has been defined as ‘an aggressive act involving the use of information and communication technologies to support deliberate, repeated and hostile behaviour by an individual or group which is intended to harm others’.7 Unwanted contact and exposure to viruses and fraud would generally not be classified as bullying, however, could be experienced as part of a bullying pattern.
Many researchers suggest that cyberbullying is a sub-set of traditional bullying rather than a new form on its own.8,9 However, there are some key differences. A unique feature of cyberbullying is the ability for the perpetrator to remain anonymous and to bully large numbers of people relatively effortlessly without a need to be physically close to them.10 For children and young people, cyberbullying can also be particularly fraught as it can happen when victims are alone, with less ability for teachers or parents to identify that it is occurring.
Evidence also suggests that young people can find it difficult to distinguish between harmless banter and bullying.11,12 This makes it more challenging for young people experiencing bullying to report the behaviour and for those perpetrating bullying to understand where the line was crossed.
Negative online experiences including cyberbullying can significantly affect a young person’s mental health and wellbeing.13,14,15 Cyberbullying can lead to significant mental health issues, including anxiety, stress and depression as well as substance abuse and in extreme cases, suicidal idealisation and actualisation.16,17 Australian research has found that mental health problems, including anxiety and depression, were more prevalent for young people who reported that they had been cyberbullied compared to those who had been bullied offline.18
In 2019, the Commissioner for Children and Young People (the Commissioner) conducted the Speaking Out Survey which sought the views of a broadly representative sample of 4,912 Year 4 to Year 12 students in WA on factors influencing their wellbeing, including a range of questions about cyberbullying.
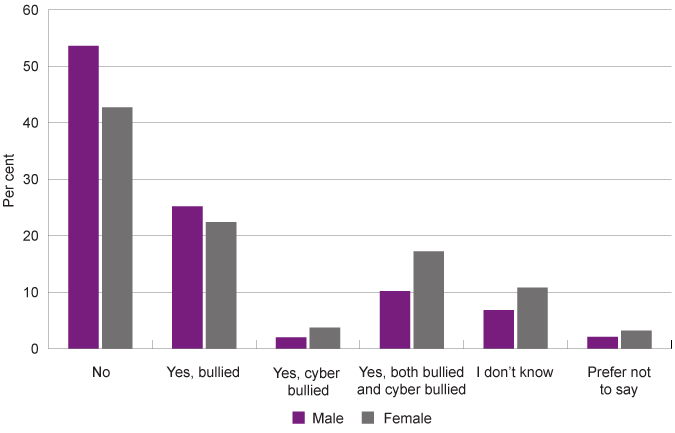
Overall, 16.9 per cent of Year 7 to Year 12 students in WA reported they had been cyberbullied by students at their school. It should be noted that this will underestimate experiences of cyberbullying as it is only bullying perpetrated by other students at school.
Cyberbullying rarely occurs in isolation. Most young people who reported experiences of cyberbullying also reported experiences of bullying.
|
Male |
Female |
Metropolitan |
Regional |
Remote |
All |
|
|
Yes, both bullied and cyberbullied |
10.2 |
17.2 |
13.5 |
17.5 |
13.2 |
14.0 |
|
Yes, cyberbullied |
2.0 |
3.7 |
2.8 |
3.9 |
1.2 |
2.9 |
|
Yes, bullied |
25.2 |
22.4 |
23.1 |
25.9 |
31.8 |
24.0 |
|
No |
53.6 |
42.7 |
49.4 |
40.6 |
43.3 |
47.9 |
|
I don't know |
6.8 |
10.8 |
8.4 |
10.2 |
8.5 |
8.6 |
|
Prefer not to say |
2.1 |
3.2 |
2.8 |
1.9 |
1.9 |
2.6 |
Source: Commissioner for Children and Young People WA 2020, Speaking Out Survey 2019 Data Tables [unpublished]
Students in regional areas were somewhat more likely to be cyberbullied than those in remote or metropolitan areas (regional: 21.4%, metropolitan: 16.3%, remote: 14.4%).
There were substantial differences between male and female responses. A higher proportion of female Year 7 to Year 12 students than male students had been cyberbullied (20.9% compared to 12.2%).
For a discussion of bullying at school refer to the indicator: A sense of belonging and supportive relationships at school.
Proportion of Year 7 to Year 12 students reporting whether they have ever been bullied, cyberbullied or both by students from their school by gender, per cent, WA, 2019
Source: Commissioner for Children and Young People WA 2020, Speaking Out Survey 2019 Data Tables [unpublished]
Aboriginal Year 7 to Year 12 students were less likely to report being cyberbullied than non-Aboriginal students (17.1% compared to 13.1%).
|
Aboriginal |
Non-Aboriginal |
|
|
Yes, both bullied and cyber bullied |
11.1 |
14.2 |
|
Yes, cyber bullied |
2.0 |
2.9 |
|
Yes, bullied |
19.7 |
24.2 |
|
No |
55.9 |
47.4 |
|
I don't know |
8.4 |
8.7 |
|
Prefer not to say |
3.0 |
2.6 |
Source: Commissioner for Children and Young People WA 2020, Speaking Out Survey 2019 Data Tables [unpublished]
International research suggests that some Aboriginal children and young people may engage with and experience social media in culturally specific ways including that culture may influence what counts as cyberbullying, and they may experience direct and indirect racism through social media which may or may not be identified as cyberbullying.19 More research is needed into Aboriginal children’s use and experiences of technology and social media.
The incidence of cyberbullying increases as young people age, with a significantly greater proportion of Year 10 to Year 12 WA students being cyberbullied than Year 7 to Year 9 students (20.5% compared to 13.6%).
|
Years 7 to 9 |
Years 10 to 12 |
|
|
Yes, both bullied and cyber bullied |
11.2 |
17.2 |
|
Yes, cyber bullied |
2.4 |
3.3 |
|
Yes, bullied |
28.0 |
19.5 |
|
No |
46.4 |
49.5 |
|
I don't know |
9.1 |
8.1 |
|
Prefer not to say |
2.9 |
2.4 |
Source: Commissioner for Children and Young People WA 2020, Speaking Out Survey 2019 Data Tables [unpublished]
Among Year 7 to Year 12 students, 44.6 per cent were sent nasty message electronically in the last three months. A higher proportion of female than male Year 7 to Year 12 students reported receiving nasty message electronically in the last three months (54.0% compared to 35.4%). Additionally, a higher proportion of female than male Year 7 to Year 12 students reported that nasty messages or pictures were sent about them to other young people via mobile phone, internet or email in the last three months (39.4% compared to 29.4%).20 These differences are not statistically significant, but are consistent with other research on cyberbullying and gender.21
In 2017, the eSafety Commissioner conducted research with Australian children and young people about their online experiences. The survey comprised a random sample of approximately 3,000 children and young people aged eight to 17 years collected over a 12-month period to June 2017.22 Results were disaggregated into two age groups, eight to 12 years and 13 to 17 years.23
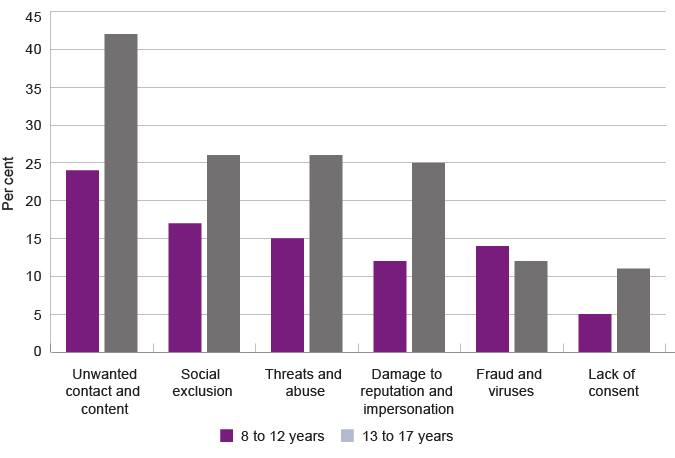
The study found that high proportions of Australian young people were exposed to a wide range of negative online experiences. For instance, 42.0 per cent of 13 to 17 year-old respondents said they had received unwanted contact and content and 26.0 per cent said they experienced social exclusion and threats and abuse.24
|
8 to 12 years |
13 to 17 years |
|
|
Unwanted contact and content |
24.0 |
42.0 |
|
Social exclusion |
17.0 |
26.0 |
|
Threats and abuse |
15.0 |
26.0 |
|
Damage to reputation and impersonation* |
12.0 |
25.0 |
|
Fraud and viruses |
14.0 |
12.0 |
|
Lack of consent** |
5.0 |
11.0 |
Source: Office of the eSafety Commissioner, State of Play – Youth, Kids and Digital Dangers
* Damage to reputation and impersonation including having lies and rumours spread about them or having inappropriate photographs posted of themselves without their consent.
** Lack of consent included having personal information accessed or posted without agreement.
Proportion of children and young people having negative online experiences by category and age group, per cent, Australia, 2017
Source: Office of the eSafety Commissioner, State of Play – Youth, Kids and Digital Dangers
A greater proportion of young people aged 12 to 17 years have negative online experiences than younger children. This aligns with the period when young people may begin to have their own phones and are using social media on a daily basis.
While proportions were relatively high for both male and female respondents, the survey found some differences between genders.
|
Male |
Female |
|
|
Unwanted contact and content |
30.0 |
35.0 |
|
Social exclusion |
19.0 |
24.0 |
|
Threats and abuse |
19.0 |
22.0 |
|
Damage to reputation and impersonation |
17.0 |
20.0 |
|
Fraud and viruses |
16.0 |
11.0 |
|
Lack of consent |
8.0 |
8.0 |
Source: Office of the eSafety Commissioner, State of Play – Youth, Kids and Digital Dangers
Female users were more likely to report all types of negative experiences with the exception of fraud and viruses. Unwanted contact and content was the most common experience for both genders followed by social exclusion (unwanted contact and content: 35.0% female compared to 30.0% male, social exclusion: 24.0% female compared to 19.0% male).
Measuring the prevalence of cyberbullying is challenging as different definitions and methodologies limit the ability to compare cohorts and determine trends over time.25
A 2014 research synthesis by the Social Policy Research Centre estimated that approximately 20.0 per cent of 8 to 17 year-olds in Australia have been cyberbullied (around 463,000 young people) and that the majority of victims are in the 10 to 15 year age group (around 365,000 young people). The authors note that the estimates could range from 100,000 less to around 200,000 more, depending on the definition of cyberbullying and other assumptions made when extrapolating from survey samples.26
Recent research also used the results of multiple bullying studies to conclude that cyberbullying in Australia is less common than traditional bullying with approximately 7.0 per cent of children and young people reporting experiences of cyberbullying and 3.5 per cent having perpetrated cyberbullying.27 However, the Commissioner’s Speaking Out Survey suggests that while traditional bullying is generally more common for younger age groups, students in Years 10 to 12 are equally likely to be bullied or cyberbullied or both.
Evidence also suggests that there is an overlap between the children and young people who experience physical bullying and cyberbullying, and those who perpetrate physical bullying and cyberbullying.28
Sexting
While sexting is not necessarily a negative online experience, it can have significant negative outcomes.
Sexting involves the sharing of sexually explicit self-generated images, videos or messages through electronic means and can be consensual.29 It should be noted that research suggests that ‘sexting’ is not a term commonly used by young people – they would more likely call it ‘nudes’ or ‘dick pics’ or an alternate.30
In the Youth Digital Participation survey conducted by the eSafety Commissioner, nearly one in three Australian young people aged 14 to 17 years reported that they had experiences of sending, sharing or being asked to share nudes images or videos.31 Young people who had these types of experiences were three times more likely to be asked for a nude or nearly nude image or video of themselves (15.0%) than to send an image or video (5.0%). Female young people were almost three times as likely as male young people to have been asked this (22.0% female compared to 8.0% male).32
Research shows that the risks associated with sexting are generally borne by female young people.33,34 These risks include having an image shared without the owner’s consent, feeling humiliated and depressed, and experiencing stalking or threatening behaviour.35
For more information on sexting and image-based abuse refer to the eSafety Commissioner’s reports:
Office of the eSafety Commissioner et al 2017, Young people and sexting – Attitudes and Behaviours: Research findings from the United Kingdom, New Zealand and Australia, Office of the eSafety Commissioner.
Office of the eSafety Commissioner et al 2017, Image-based Abuse – National Survey Summary Report, Office of the eSafety Commissioner.
Response to and impact of negative online experiences
Negative online experiences affect children and young people in a range of ways. In the eSafety Commissioner’s survey, almost two-thirds (63.0%) of respondents aged eight to 17 years reflected negatively on what happened to them. Survey participants noted that they did not feel good about themselves, felt left out and lost some of their friends. Young people were more likely to reflect negatively on their experiences than children (69.0% of 13 to 17 year-olds compared to 55.0% of 8 to 12 year-olds).36
To cope with these experiences, children and young people undertook a range of actions. The majority of eight to 17 year-olds (71.0%) sought help through informal networks, telling their parents, family and friends. Just over one-half (51.0%) employed their own self-help strategies, for example changing passwords, closing social media accounts, confronting the bully or researching solutions online. A smaller proportion (24.0%) utilised formal avenues, reporting the incident to the police, their school or the social media company. These results are not broken down further by age.37
In dealing with these experiences, many children and young people also reported gaining positive outcomes from having negative online experiences, with 65.0 per cent of eight to 17 year-olds being able to able to interpret what had happened in a positive way. This included becoming more aware of online risks (40.0%), knowing who their ‘real’ friends were (33.0%), learning to use the internet in a more balanced way (23.0%) and developing a greater understanding of their online behaviour (19.0%).38
Young people had a greater ability than children to interpret their negative experience in a positive way (70.0% of 13 to 17 year-olds compared to 58.0% of 8 to 12 year-olds).
Parents’ concerns and responses
Parents play a significant role in ensuring their children are safe online and in supporting positive online behaviours; mitigating risk, providing guidance and advice and ‘policing’ internet use. While parents of young people aged 12 to 17 years have less supervisory control than parents of younger children, their guidance and support are critical.
In research undertaken by the eSafety Commissioner in 2018, 3,250 Australian parents of children and young people aged two to 17 years shared their views about parenting in the digital age.39 The top four concerns of parents of children and young people aged six to 17 years were:40
- Contact with strangers (40.0%)
- Exposure to inappropriate content (other than pornography) (37.0%)
- Being bullied online (37.0%)
- Accessing/being exposed to pornography (37.0%).
The most common ways for parents to find out about their child’s negative online experiences was being told by them (59.0%), highlighting the importance of having a good parent-child relationship.41
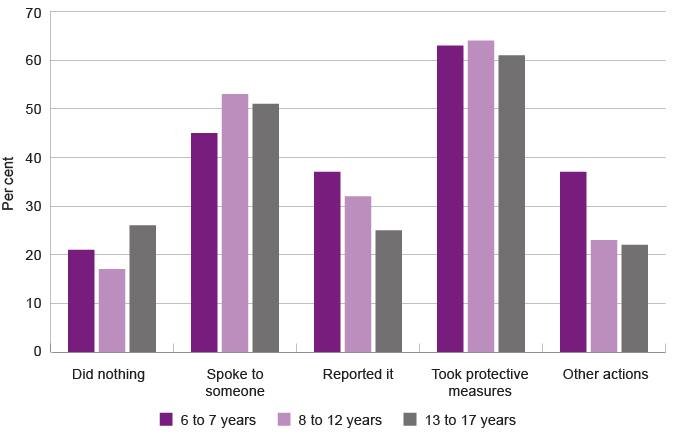
Overall, the majority of parents (62.0%) in this study dealt with these concerns themselves, by taking proactive measures including educating their child on how to deal with negative situations, increasing monitoring or requesting that the child block or unfriend the person responsible.42 Parents responded differently depending on the age of their child.
|
6 to 7 years |
8 to 12 years |
13 to 17 years |
|
|
Did nothing |
21.0 |
17.0 |
26.0 |
|
Spoke to someone |
45.0 |
53.0 |
51.0 |
|
Reported it |
37.0 |
32.0 |
25.0 |
|
Took protective measures |
63.0 |
64.0 |
61.0 |
|
Other actions* |
37.0 |
23.0 |
22.0 |
Source: Office of the eSafety Commissioner 2018, Parenting in the digital age
Note: Parents were able to select more than one response.
How parents dealt with their child’s negative online experience by age of child, per cent, Australia, 2018
Source: Office of the eSafety Commissioner 2018, Parenting in the digital age
Similar proportions of parents across all age groups took protective measures and spoke to someone, while parents of older children were less likely to report negative experiences and more likely to do nothing.
The survey results also showed that in terms of responding to disclosures, parents of teenage daughters were more likely to report the negative behaviour and take protective measures.43
While parents are clearly concerned about online safety, they do not appear to be very proactive in seeking out online safety information preceding a negative online experience, with only 36.0 per cent saying they searched for or received online safety information.44
A Victorian survey45 conducted in 2017 with 2,600 parents found that respondent parents had a range of strategies to monitor and control their child’s online use which varied with age.
|
6 to 12 years |
13 to 18 years |
|
|
I talk about safe use of internet connected devices* |
82.8 |
86.5 |
|
I established ground rules* |
91.0 |
80.9 |
|
I limit time use* |
85.6 |
52.8 |
|
I monitor online activity* |
74.3 |
48.1 |
|
I supervise use* |
79.9 |
40.7 |
|
I do not monitor my child’s use of devices* |
7.8 |
22.1 |
|
I use child safety software and locks* |
48.3 |
22.1 |
|
Something else* |
13.6 |
14.0 |
|
Not relevant to my child (too young)* |
5.6 |
1.4 |
|
Child is not allowed to use electronic devices at all* |
0.6 |
1.0 |
Source: Parenting Resource Centre, Parenting Today in Victoria Technical Report
*statistically significant difference across age groups, p<.001.
Parents of young people aged 13 to 18 years were most likely to talk about safe use (86.5%) and establish ground rules (80.9%). Parents’ strategies change as children age with limiting time use and supervision reducing significantly.
No data is available on WA parents’ experiences or opinions about their children’s online activities.
Endnotes
- Australian Bureau of Statistics (ABS) 2018, 8146.0 - Household Use of Information Technology, Australia, 2016-17, ABS.
- Commissioner for Children and Young People WA 2020, Speaking Out Survey 2019 Data Tables, Commissioner for Children and Young People WA [unpublished].
- Ibid.
- Australian Communications and Media Authority 2019, Kids and mobiles: how Australian children are using mobile phones, Australian Communications and Media Authority [online].
- Australian Communications and Media Authority 2019, Kids and mobiles: how Australian children are using mobile phones, Australian Communications and Media Authority [online].
- Office of the eSafety Commissioner 2018, State of Play – Youth, Kids and Digital Dangers, Office of the eSafety Commissioner, p. 8.
- Jadambaa A et al 2019, Prevalence of traditional bullying and cyberbullying among children and adolescents in Australia: a systematic review and meta-analysis, Australian and New Zealand Journal of Psychiatry, Vol 53, No 9.
- Kowalski R and Limber S 2013, Psychological, Physical, and Academic Correlates of Cyberbullying and Traditional Bullying, Journal of Adolescent Health, Vol 53, No 1.
- Jadambaa A et al 2019, Prevalence of traditional bullying and cyberbullying among children and adolescents in Australia: a systematic review and meta-analysis, Australian and New Zealand Journal of Psychiatry, Vol 53, No 9.
- Hemphill S et al 2015, Predictors of Traditional and Cyber-Bullying Victimization: A Longitudinal Study of Australian Secondary School Students, Journal of Interpersonal Violence, Vol 30, No 15.
- Jeffrey J and Stuart J 2019, Do Research Definitions of Bullying Capture the Experiences and Understandings of Young People? A Qualitative Investigation into the Characteristics of Bullying Behaviour, International Journal of Bullying Prevention, https://doi.org/10.1007/s42380-019-00026-6 [online].
- Whittle J et al 2019, ‘There’s a Bit of Banter’: How Male Teenagers ‘Do Boy’ on Social Networking Sites, in Lumsden K and Harmer E (eds) Online Othering, Palgrave Studies in Cybercrime and Cybersecurity. Palgrave Macmillan, Cham.
- Wu Y et al 2016, A Systematic Review of Recent Research on Adolescent Social Connectedness and Mental Health with Internet Technology Use, Adolescent Research Review, Vol 1, No 2
- Tandoc E et al 2015, Facebook use, envy, and depression among college students: Is facebooking depressing?, Science Direct, Vol 43 p 139-146.
- Child Family Community Australia 2012, Parental involvement in preventing and responding to cyberbullying, Australian Institute of Family Studies, Australian Government.
- O'Keeffe GS et al 2011, Clinical report: The impact of social media on children, adolescents, and families, Pediatrics, Vol 127, No 4, p. 801.
- Carlson B and Frazer R 2018, Cyberbullying and Indigenous Australians: A Review of the Literature, Aboriginal Health and Medical Research Council of New South Wales and Macquarie University, Sydney.
- Child Family Community Australia 2012, Parental involvement in preventing and responding to cyberbullying, Australian Institute of Family Studies, Australian Government.
- Carlson B and Frazer R 2018, Cyberbullying and Indigenous Australians: A Review of the Literature, Aboriginal Health and Medical Research Council of New South Wales and Macquarie University, Sydney, p. 12-13.
- Commissioner for Children and Young People WA 2020, Speaking Out Survey 2019 Data Tables, Commissioner for Children and Young People WA [unpublished].
- Office of the ESafety Commissioner 2018, State of Play – Youth, Kids and Digital Dangers, Australian Government, p. 22.
- Office of the ESafety Commissioner 2018, State of Play – Youth, Kids and Digital Dangers, Australian Government, p. 3.
- This is because major social media sites (e.g. Facebook, Instagram and YouTube) specify that users must be at least 13 years-old. Source: Child Family Community Australia 2018, Online Safety: CFCA Resource Sheet, Australian Institute of Family Studies.
- Office of the ESafety Commissioner 2018, State of Play – Youth, Kids and Digital Dangers, Australian Government, p. 21.
- Jadambaa A et al 2019, Prevalence of traditional bullying and cyberbullying among children and adolescents in Australia: a systematic review and meta-analysis, Australian and New Zealand Journal of Psychiatry, Vol 53, No 9.
- Katz I et al 2014, Research on youth exposure to, and management of, cyberbullying incidents in Australia: Synthesis report (SPRC Report 16/2014), Social Policy Research Centre, UNSW Australia, p. 2.
- Jadambaa A et al 2019, Prevalence of traditional bullying and cyberbullying among children and adolescents in Australia: a systematic review and meta-analysis, Australian and New Zealand Journal of Psychiatry, Vol 53, No 9.
- Katz I et al 2014, Research on youth exposure to, and management of, cyberbullying incidents in Australia: Synthesis report (SPRC Report 16/2014), Social Policy Research Centre, UNSW Australia, p. 3.
- Madigan S et al 2018, Prevalence of Multiple Forms of Sexting Behavior Among Youth: A Systematic Review and Meta-analysis, JAMA Pediatrics, Vol 172, No 4.
- Office of the eSafety Commissioner et al 2017, Young people and sexting – Attitudes and Behaviours: Research findings from the United Kingdom, New Zealand and Australia, Office of the eSafety Commissioner, p. 14.
- Ibid, p. 14.
- Ibid, p. 14.
- Doring N 2014, Consensual sexting among adolescents: Risk prevention through abstinence education or safer sexting?, Cyberpsychology: Journal of Psychosocial Research on Cyberspace, Vol 8, No 1.
- Office of the eSafety Commissioner 2017, Image-based abuse: National survey – summary report, Australian Government.
- Ibid.
- Office of the ESafety Commissioner 2018, State of Play – Youth, Kids and Digital Dangers, Australian Government, p. 23.
- Ibid, p. 24.
- Ibid, p. 23.
- Office of the eSafety Commissioner 2018, Parenting in the digital age, Australian Government, p. 2.
- Ibid, p. 6.
- Ibid, p. 14.
- Ibid, p. 18.
- Ibid, p. 20.
- Ibid, p. 21.
- Parenting Research Centre (PRC) 2017, Parenting Today in Victoria: Report of Key Findings (report produced for the Department of Education and Training, Victoria), PRC.
Last updated August 2020
Children and young people who are exposed to violence in their community are at higher risk of negative long-term outcomes including substance abuse, anxiety-related disorders and exhibiting future violent behaviour.1,2
Exposure to violence in the community can also contribute to problems forming positive and trusting relationships and is strongly associated with young people exhibiting conduct problems.3
Community violence generally refers to violence in the community that is not perpetrated by a family member and is intended to cause harm.4 For young people aged 12 to 17 years, exposure to violence in the community may be observing or experiencing bullying or aggression from adults or peers or physical (and sexual) assault.
This measure ideally reports on experiences of physical and sexual assault outside of the family and the home (which is discussed in the Safe in the home indicator); however, available data does not always distinguish between violence in the community and family and domestic violence.
In 2019, the Commissioner for Children and Young People (the Commissioner) conducted the Speaking Out Survey which sought the views of a broadly representative sample of 4,912 Year 4 to Year 12 students in WA on factors influencing their wellbeing, including a range of questions about feeling safe and experiences of harm.
The survey asked Year 9 to 12 students a series of questions about being physically harmed on purpose and found that one-half of students (50.8%) had been hit or physically harmed by someone on purpose.
|
Male |
Female |
Metropolitan |
Regional |
Remote |
All |
|
|
Yes |
55.7 |
44.7 |
50.8 |
48.3 |
60.3 |
50.8 |
|
No |
33.6 |
42.6 |
37.1 |
42.3 |
27.4 |
37.4 |
|
I don't know |
8.2 |
8.8 |
9.1 |
5.3 |
10.3 |
8.6 |
|
Prefer not to say |
2.5 |
4.0 |
3.0 |
4.1 |
2.1 |
3.2 |
Source: Commissioner for Children and Young People WA 2020, Speaking Out Survey 2019 Data Tables [unpublished]
A significantly higher proportion of male than female students reported they had been hit or physically harmed by someone on purpose (55.7% male compared to 44.7% female).
A significantly lower proportion of Year 9 to Year 12 students in remote regions reported they had never been hit or physically harmed by someone on purpose than in metropolitan regions (27.4% compared to 37.1%). There was no significant difference between responses for Aboriginal and non-Aboriginal young people.
The most frequently reported locations for harm to occur were at home (53.2%) and at school (43.6%). There were however significant differences between male and female students regarding where the harm occurred.
|
Male |
Female |
Total |
|
|
At home |
38.2 |
72.5 |
53.2 |
|
At school |
57.4 |
27.7 |
43.6 |
|
At a sports event |
18.0 |
7.7 |
13.6 |
|
In my neighbourhood |
10.2 |
6.3 |
8.6 |
|
Hanging out in a public place |
15.1 |
7.9 |
12.9 |
|
Public transport |
4.6 |
5.2 |
5.1 |
Source: Commissioner for Children and Young People WA 2020, Speaking Out Survey 2019 Data Tables [unpublished]
Of the students reporting they had been hit or physically harmed, female students were most likely to be physically harmed at home with almost three-quarters of respondents (72.5%) saying this. Male students on the other hand were most likely to be physically harmed at school (57.4%) and other public places including sports events (18.0%), hanging out in a public place (15.1%) or in the neighbourhood (10.2%).
Of the students who reported they had been hit or physically harmed on purpose, 30.4 per cent reported this happened once or twice in the last 12 months, 12.8 per cent reported this happened three or four times and 14.8 per cent reported this happened five or more times in the last 12 months.5
Victims of crime
The ABS collects data on victims of physical assault6 and sexual assault in the Recorded Crimes – Victims publication from administrative systems maintained by police agencies within each state and territory.7 This collection includes data on physical assault and sexual assault for children and young people, however, does not always distinguish between crime in the community and family and domestic violence.
In 2019, 62.5 per cent of physical assaults and 27.3 per cent of sexual assaults recorded in WA were family and domestic violence-related.8
For more information on experiences of family and domestic violence for children and young people refer to the Safe in the home indicator.
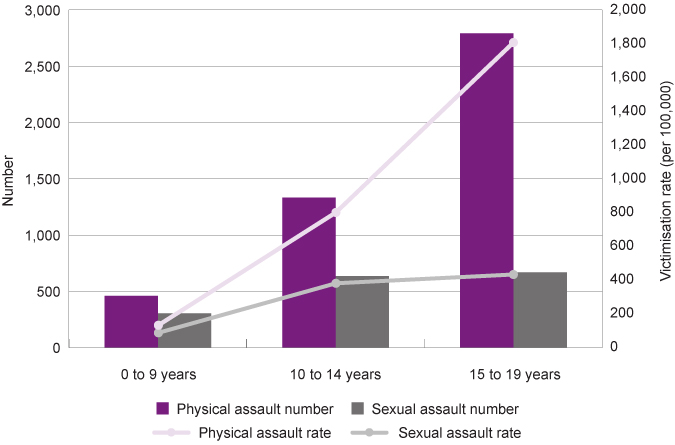
In WA in 2019, 4,124 children and young people aged 10 to 19 years were recorded as victims of physical assault and 1,303 children and young people aged 10 to 19 years were recorded as victims of sexual assault.
It should be noted that the following statistics are based on crimes recorded by WA Police and therefore will underestimate the prevalence of assault, particularly sexual assault for young women.9,10
|
Physical assault |
Sexual assault |
|||
|
Number |
Number per 100,000 |
Number |
Number per 100,000 |
|
|
0 to 9 years |
459 |
132.8 |
304 |
87.9 |
|
10 to 14 years |
1,332 |
801.8 |
634 |
381.6 |
|
15 to 19 years |
2,792 |
1,809.9 |
669 |
433.7 |
Source: ABS, Recorded Crime - Victims, Australia, 2019, Table 7 Victims, Age by selected offences and sex, States and territories, 2019
WA children and young people recorded as victims of physical assault and sexual assault by age, number and rate, WA, 2019
Source: ABS, Recorded Crime - Victims, Australia, 2019, Table 7 Victims, Age by selected offences and sex, States and territories, 2019
Young people aged 15 to 19 years are at greater risk of physical and sexual assault than children and young people aged 10 to 14 years (2.3 times more likely to experience physical assault and 1.1 times more likely to experience sexual assault).
There is no data publicly available on the location of these offences for these age groups. However, for the total population (including adults), 63.4 per cent of physical assaults and 71.9 per cent of sexual assaults occurred in a residential location.11
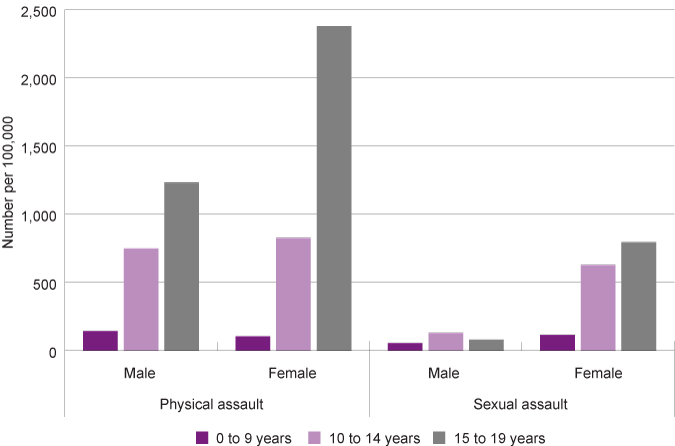
There are significant differences between male and female young people’s experiences of violence with female children and young people being significantly more likely to be the victims of physical and sexual assault across all age groups, except physical assault of 0 to nine year-old children.
Notably, female young people aged 15 to 19 years are 9.8 times more likely than male young people in that age group to be reported as victims of sexual assault.
|
Physical assault |
Sexual assault |
|||
|
Male |
Female |
Male |
Female |
|
|
0 to 9 years |
255 |
178 |
98 |
195 |
|
10 to 14 years |
639 |
670 |
112 |
510 |
|
15 to 19 years |
973 |
1,794 |
64 |
600 |
Source: ABS, Recorded Crime - Victims, Australia, 2019, Table 7 Victims, Age by selected offences and sex, States and territories, 2019
|
Physical assault |
Sexual assault |
|||
|
Male |
Female |
Male |
Female |
|
|
0 to 9 years |
143.8 |
105.7 |
55.3 |
115.8 |
|
10 to 14 years |
750.9 |
826.8 |
131.6 |
629.4 |
|
15 to 19 years |
1,233.4 |
2,380.0 |
81.1 |
796.0 |
Source: ABS, Recorded Crime - Victims, Australia, 2019, Table 7 Victims, Age by selected offences and sex, States and territories, 2019
Children and young people recorded as victims of assault and sexual assault by age group and gender, number per 100,000, WA, 2019
Source: ABS, Recorded Crime - Victims, Australia, 2019, Table 7 Victims, Age by selected offences and sex, States and territories, 2019
Generally, the risk of children and young people being physically or sexually assaulted increases with age (except for male victims of sexual assault).
Female young people aged 15 to 19 years are at a significantly higher risk of both physical and sexual assault than male young people in this age group. Female young people aged 15 to 19 years have the highest risk of sexual assault across all age groups (796 per 100,000 female young people).12
A high proportion of these assaults will be family and domestic violence related. In 2019 Australian females were sexually assaulted by an intimate partner or family member (family and domestic violence related) at a rate six times higher than males, with 60 female victims per 100,000 females and 10 male victims per 100,000 males. The majority of Australian female victims of sexual assault were under 19 years of age (52.0%).13
It must also be noted that according to the ABS Personal Safety Survey the majority of women (9 out of 10) who were sexually assaulted did not contact the police after the incident.14
Overall from 15 years of age, women in Australia are at greatest risk of violence from a cohabiting partner, while men are more likely to experience violence from a stranger (27.0%) or an acquaintance or neighbour (7.4%) than a family member since the age of 15 years.15
Female young people are at risk of experiencing sexual harassment as well as sexual assault.16 Young women are particularly affected by sexual harassment on the street and in other public places, through technology and social media and in schools and universities.17 In recent years there has been increasing information and community discussion on understanding consent and what sexual harassment and assault looks like.
The National Community Attitudes towards Violence against Women Survey (NCAS) was conducted in 2017 and reported on young people’s (aged 16 to 24 years) attitudes to violence against women and gender equality.18 This survey found that most young people aged 16 to 24 years have a good knowledge of key aspects of violence against women, support gender equality, reject attitudes supportive of violence against women, and say they would act or like to act if they witnessed abuse or disrespect of women.19
However, the survey also found that 24.0 per cent of young men thought that women find it flattering to be pursued even if they are not interested (compared to 13.0 per cent of young women) and approximately one in seven young Australians (male and female) believe a man would be justified to force sex if the woman initiated the intimacy, but then changed her mind and pushed him away.20
Data from the ABS 2014–15 National Aboriginal and Torres Strait Islander Social Survey (NATSISS) records experiences of safety and neighbourhood problems for Aboriginal people across Australia. In this survey, 18.2 per cent of male Aboriginal young people aged 15 to 24 years experienced physical violence in last 12 months, while 15.4 per cent of female Aboriginal young people aged 15 to 24 experienced physical violence in last 12 months.21
The Australian Bureau of Statistics collection on Recorded Crime – Victims does not report on data for Aboriginal people in WA as the data is not of sufficient quality.22 Furthermore, the National Aboriginal and Torres Strait Islander Social Survey (NATSISS) does not provide data on children and young people’s experiences of violence.23
Children and young people from the most socioeconomically disadvantaged areas are five times more likely to be hospitalised due to assault than other children and young people.24
|
1-Lowest |
2 |
3 |
4 |
5-Highest |
||
|
0 to 4 years |
Number |
91 |
48 |
22 |
12 |
16 |
|
Rate |
27.7 |
15.7 |
7.0 |
3.8 |
5.4 |
|
|
5 to 14 years |
Number |
142 |
88 |
70 |
56 |
30 |
|
Rate |
23.5 |
15.4 |
11.9 |
9.6 |
4.8 |
|
Source: AIHW, Hospitalised injury and socioeconomic influence in Australia 2015–16
Notes:
1. Only a small proportion of injuries result in admission to a hospital.
2. Rates are directly age-standardised (per 100,000) using populations by socioeconomic status groups, which do not include persons in areas for which the socioeconomic status could not be determined.
3. Assault in this publication is defined according to the International Statistical Classification of Diseases and Related Health Problems (ICD-10) and includes sexual assault.
Hospitalised assault injury cases by socioeconomic status and age group, age-specific rate, Australia, 2015–16
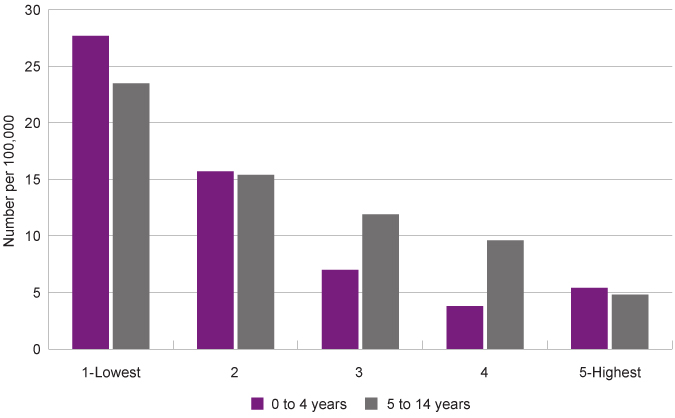
Higher rates of injury in communities with low socioeconomic status are related to the social determinants of health which increase risk factors for people living with disadvantage. Children and young people experiencing socioeconomic disadvantage are more likely to be living in communities where there are higher levels of unemployment, families experiencing poverty or financial stress, poor housing conditions and a lack of access to services.25
Young people are also at risk of abuse, particularly sexual abuse, within institutions. The Royal Commission into Institutional Responses to Child Sexual Abuse (the Royal Commission) found that a large number of children have been sexually abused in many Australian institutions. The Royal Commission highlighted that sexual abuse of children has occurred in almost every type of institution where children reside or attend for educational, recreational, sporting, religious or cultural activities.
It should be noted that while the Royal Commission was unable to determine the prevalence of child sexual abuse, more than one-half (51.5%) of the survivors reporting to the Royal Commissioner were 10 to 14 years of age when they were first sexually abused.26
There is no data on the prevalence of child abuse, including sexual abuse, in institutional settings in WA.27 It is expected that this will be at least partially addressed by the Australian Child Maltreatment Study funded by the National Health and Medical Research Council.
Endnotes
- Guerra NG and Dierkhising MA 2011, The Effects of Community Violence on Child Development, Encyclopedia on Early Childhood Development.
- Luthar S and Goldstein A 2015, Children’s Exposure to Community Violence: Implications for Understanding Risk and Resilience, Journal of Clinical Child Adolescent Psychology, Vol 33, No 3.
- Kersten L et al 2017, Community Violence Exposure and Conduct Problems in Children and Adolescents with Conduct Disorder and Healthy Controls, frontiers in Behavioural Neuroscience, Vol 11.
- Guerra NG and Dierkhising MA 2011, The Effects of Community Violence on Child Development, Encyclopedia on Early Childhood Development.
- Commissioner for Children and Young People WA 2020, Speaking Out Survey 2019 Data Tables, Commissioner for Children and Young People WA [unpublished].
- The Australian Bureau of Statistics uses the language of ‘assault’ and sexual assault, for simplicity the Commissioner uses the term ‘physical assault’ instead of ‘assault’.
- The Australian Bureau of Statistics defines assault as the direct (and immediate/confrontational) infliction of force, injury, or violence upon a person or persons, or the direct (and immediate/ confrontational) threat of force, injury or violence where there is an apprehension that the threat could be enacted. They define sexual assault as physical contact, or intent of contact, of a sexual nature directed toward another person where that person does not give consent, gives consent as a result of intimidation or deception, or consent is proscribed (i.e. the person is legally deemed incapable of giving consent because of youth, temporary/permanent (mental) incapacity or there is a familial relationship). Source: Australian Bureau of Statistics 2020, Glossary, ABS.
- Australian Bureau of Statistics 2020, 4510.0 - Recorded Crime - Victims, Australia, 2019, Table 22 Victims of family and domestic violence-related offences by sex, ABS.
- Australian Bureau of Statistics 2013, Defining the Data Challenge for Family, Domestic and Sexual Violence, ABS.
- Australian Law Reform Commission 2010, The prevalence of sexual violence, Australian Government [website].
- Australian Bureau of Statistics 2020, 4510.0 - Recorded Crime - Victims, Australia, 2019, Table 8 Victims, Location where offence occurred by selected offences, States and territories, 2019.
- Australian Bureau of Statistics 2020, 4510.0 - Recorded Crime - Victims, Australia, 2019, Table 7 Victims, Age by selected offences and sex, States and territories, 2019.
- Australian Bureau of Statistics 2020, Summary: Victims of Family and Domestic Violence related offences, ABS.
- Australian Bureau of Statistics 2017, 4906.0 - Personal Safety, Australia, 2016 – Key Findings, ABS.
- Australian Institute of Health and Welfare 2018, Family, domestic and sexual violence in Australia 2018, Cat no FDV 2, AIHW, p. 23.
- Politoff V et al 2019, Young Australians’ attitudes to violence against women and gender equality: Findings from the 2017 National Community Attitudes towards Violence against Women Survey (NCAS), Australian National Research Organisation for Women’s Safety (ANROWS) Insights, Issue 01/2019, ANROWS, p. 5.
- Ibid, p. 5.
- Ibid.
- Ibid, p. 6.
- Ibid, p. 27, 31
- Australian Bureau of Statistics (ABS) 2016, 4714.0 - National Aboriginal and Torres Strait Islander Social Survey, 2014-15, Table 15.3 Safety, law and justice, by sex, age and remoteness, Aboriginal and Torres Strait Islander persons aged 15 years and over — 2014–15, Proportion of persons, ABS.
- Australian Bureau of Statistics (ABS) 2019, 4510.0 - Recorded Crime - Victims, Australia, 2018 Explanatory Notes, ABS.
- Australian Bureau of Statistics (ABS) 2016, 4714.0 - National Aboriginal and Torres Strait Islander Social Survey, 2014-15, ABS.
- Australian Institute of Health and Welfare (AIHW) and Pointer SC 2019, Hospitalised injury and socioeconomic influence in Australia, 2015–16, Injury research and statistics series No 125, Cat No INJCAT 205, AIHW.
- American Psychological Association 2019, Fact sheet: violence and socioeconomic status, American Psychological Association.
- Royal Commission into Institutional Responses to Child Sexual Abuse 2017, Final Report: Nature and Cause, Australian Government, p. 87.
- Royal Commission into Institutional Responses to Child Sexual Abuse 2017, Nature and cause: summary, Australian Government [website].
Last updated December 2019
At 30 June 2019, there were 2,420 WA young people in care aged between 10 and 17 years, more than one-half of whom (53.3%) were Aboriginal.1
In 2017, CREATE Foundation collected data from Australian children and young people aged 10 to 17 years about their lives in the care system.2 Only 31.4 per cent of respondents indicated they had a sense of connection with the community in which they live.3 There is no other information on this measure.
There is no data or information publicly available on whether WA young people in care aged 12 to 17 years feel safe in the community that they live in.
Endnotes
- Department of Communities 2019, Annual Report: 2018-19, WA Government p. 26.
- CREATE Foundation have noted in their 2018 report that recruitment of participants was difficult and resulted in a non-random sample. McDowall JJ 2018, Out-of-home care in Australia: Children and young people’s views after five years of National Standards, CREATE Foundation, p. 17-19.
- McDowall JJ 2018, Out-of-home care in Australia: Children and young people’s views after five years of National Standards, CREATE Foundation, p. 9.
Last updated August 2020
The Australian Bureau of Statistics Disability, Ageing and Carers, 2018 data collection reports that approximately 30,200 WA children and young people (9.2%) aged five to 14 years have reported disability.1,2
Young people with disability are at greater risk of not feeling safe in their community and experiencing violence and abuse.3,4,5
Recent Australian research reported that 16 to 30 year-olds with disability feel safe in their communities when embedded in organisations and groups in their local communities, and have supportive relationships with workers and peers in these places. What mattered most was being known and valued, and listened to if they raised concerns about safety.6
There are no nationally consistent data sets available to determine the extent of violence, abuse and neglect of children and young people with disability.7
In 2019, the Commissioner for Children and Young People (the Commissioner) conducted the Speaking Out Survey which sought the views of a broadly representative sample of Year 4 to Year 12 students in WA on factors influencing their wellbeing.8 This survey was conducted across mainstream schools in WA; special schools for students with disability were not included in the sample.
In this survey Year 7 to Year 12 students were asked: Do you have any long-term disability (lasting 6 months or more) (e.g. sensory impaired hearing, visual impairment, in a wheelchair, learning difficulties)? In total, 315 (11.4%) participating Year 7 to Year 12 students answered yes to this question.
There is a substantial proportion of students who responded ‘I don’t know’ to this question, their wellbeing scores are generally less favourable than both other groups. Further analysis of these young people’s experiences will be undertaken in the future.
Due to the relatively small sample size, the following results for students who reported long-term disability are observational and not representative of the full population of students with disability in Years 7 to 12 in WA. Comparisons between participating students with and without disability are therefore not statistically significant. Nevertheless, the results provide an indication of the views and experiences of young people with disability about safety in the home.
Similar proportions of young people with and without disability feel safe in their local area all the time (23.6% compared to 25.5%).
|
Young people with disability |
Young people without disability |
|
|
All of the time |
23.6 |
25.5 |
|
Most of the time |
40.5 |
43.0 |
|
Sometimes |
20.5 |
19.1 |
|
A little bit of the time |
10.5 |
8.7 |
|
Never |
4.4 |
2.7 |
|
Does not apply to me |
0.3 |
0.6 |
|
Prefer not to say |
0.2 |
0.5 |
Source: Commissioner for Children and Young People WA 2020, Speaking Out Survey 2019 Data Tables [unpublished]
Almost 15 per cent (14.9%) of young people with disability feel safe in their local area only a little bit of the time or never, compared to 11.4 per cent of young people without disability. Further, 30 per cent (27.6%) of young people with disability do not feel safe on public transport (compared to 21.0% of young people without disability).9
No data is available on whether WA young people with disability feel safe when engaging with institutions (such as sporting clubs or other organisations).
Research was commissioned by the Royal Commission into Institutional Responses to Child Sexual Abuse (the Royal Commission) to develop an understanding what helps children and young people with disability and high support needs to feel and be safe in institutional settings. This was a small study with 22 children and young people aged between seven and 25 years.10
This research found that children and young people with disability were vulnerable because institutional practices often isolated them from their local communities and long-term support relationships.11 The study also suggested that children and young people with disability can have a diminished social life as they find it difficult to assess the relative risk of harm and can fear people they do not know, as ‘stranger danger’ is emphasised by parents and caregivers.12
The Royal Commission also concluded that children with disability who disclosed sexual abuse were often not believed or their distress was explained as a function of their disability. Furthermore, survivors with communication and cognitive impairments were reliant on supportive adults noticing and understanding changes in their behaviour after the abuse.13
The Royal Commission into Violence, Abuse, Neglect and Exploitation of People with Disability has been established to specifically address evidence that people with disability are being abused in institutional and other settings. This Royal Commission is currently receiving submissions and holding hearings.
Endnotes
- ABS uses the following definition of disability: ‘In the context of health experience, the International Classification of Functioning, Disability and Health (ICFDH) defines disability as an umbrella term for impairments, activity limitations and participation restrictions… In this survey, a person has a disability if they report they have a limitation, restriction or impairment, which has lasted, or is likely to last, for at least six months and restricts everyday activities.’ Australian Bureau of Statistics 2016, Disability, Ageing and Carers, Australia, 2015, Glossary.
- Estimate is to be used with caution as it has a relative standard error of between 25 and 50 per cent. Australian Bureau of Statistics 2016, Disability, Ageing and Carers, Australia, 2018: Western Australia, Table 1.1 Persons with disability, by age and sex, estimate and Table 1.3 Persons with disability, by age and sex, proportion of persons.
- Wayland S and Hindmarsh G 2017, Understanding safeguarding practices for children with disability when engaging with organisations, Child Family Community Australia, Australian Institute of Family Studies, p. 3.
- Robinson S 2016, Feeling safe, being safe: what is important to children and young people with disability and high support needs about safety in institutional settings?, Centre for Children and Young People, Southern Cross University, p. 9.
- Jones L et al 2012, Prevalence and risk of violence against children with disabilities: a systematic review and meta-analysis of observational studies, The Lancet, Vol 380, No 9845.
- Robinson S et al 2017, Preventing abuse and promoting personal safety in young people with disability, Southern Cross University.
- Community Affairs References Committee 2015, Violence, abuse and neglect against people with disability in institutional and residential settings, including the gender and age related dimensions, and the particular situation of Aboriginal and Torres Strait Islander people with disability, and culturally and linguistically diverse people with disability, Commonwealth of Australia, p. 37.
- Commissioner for Children and Young People WA 2020, Speaking Out Survey: The views of WA children and young people on their wellbeing - a summary report, Commissioner for Children and Young People WA.
- Commissioner for Children and Young People WA 2020, Speaking Out Survey 2019 Data Tables, Commissioner for Children and Young People WA [unpublished]
- Robinson S 2016, Feeling safe, being safe: what is important to children and young people with disability and high support needs about safety in institutional settings?, Centre for Children and Young People, Southern Cross University.
- Ibid, p. 9.
- Ibid, p. 9.
- Royal Commission into Institutional Responses to Child Sexual Abuse 2017, Final Report: Preface and executive summary, Australian Government, p. 14.
Last updated August 2020
Safe places and spaces in the community help young people develop their independence and have the confidence to lead healthy, active lifestyles.1 Feeling safe in the community increases the likelihood that young people will engage in extra-curricular activities and build supportive relationships with other young people and adults.
The right to enjoy community life in places and spaces that are safe and welcoming is something all young people are entitled to under the United Nations Convention on the Rights of the Child (UNCRC).2
Young people who are exposed to violence or abuse in their community either as victims or onlookers can experience multiple negative outcomes including problems forming relationships, mental health issues and increased likelihood of engaging in risk-taking behaviour.3,4,5
Local communities can play a significant role in supporting vulnerable young people, particularly where services are not meeting their needs. Building respectful, trusting relationships with vulnerable young people has a powerful impact and can be the circuit breaker that disrupts their trajectory of vulnerability and creates a pathway for positive change.6
Creating safe neighbourhoods and communities for young people aged 12 to 17 years requires a number of areas of focus:
- Ensuring public transport and public spaces such as parks and footpaths are safe for young people, particularly at night.
- Ensuring community-based organisations and general community members have a no-tolerance approach to gender-based harassment and violence.
- Ensuring organisations that interact with young people, including sports/activity groups, schools and council facilities employ child safe policies and practices.
- Implementing policies which are focused on reducing disadvantage and social exclusion more broadly, which can indirectly reduce crime and antisocial behaviour in socially and economically disadvantaged communities.7,8
Safe, accessible places are an important component of healthy communities and have an impact on community cohesion and how a community works together, shares values and overcomes adversity. Ensuring public spaces are safe and responsive to the local community’s needs is critical. This includes asking young people what would make the public spaces in their community more safe and welcoming for them.
Communities where there are low incomes, high unemployment and limited access to services are more likely to have higher levels of crime and antisocial behaviour.9 Poverty does not cause criminal behaviour, however, the experience of being poor creates material and social conditions (high levels of stress, mental health issues, lack of access to services etc.) that increase the likelihood of being a victim or perpetrator of criminal behaviour.10
A law and order response which criminalises adults (who are often parents) and some children and young people, does not lead to long term change for that community.11,12 Policies which support communities to address identified issues should be place-based and designed by the people, including young people, in that community so they are tailored to local circumstances and the community’s needs.13,14
Furthermore, policies which address poverty and disadvantage more broadly are essential to improve affected young people’s experiences of feeling and being safe in their community.
Survey data and research show that young women are particularly vulnerable to not only feeling unsafe in their community, but also being unsafe. This requires a concerted effort by not only government, but also community members to ensure that sexual discrimination, harassment and violence are not tolerated. The majority of sexual harassment and violence cases continues to go unreported despite multiple studies proving that false allegations of sexual violence are rare.15 In addition, survey data shows that 31 per cent of young Australian men believe that women exaggerate the problem of male violence.16 Continued investment in school-based education campaigns on respectful relationships and consent are critical.
Online safety is also important for young people aged 12 to 17 years. There has been considerable research and policy focus on safety and bullying for young people over recent years, including online safety. Educating young people about online safety is critically important, as without appropriate support and guidance, negative experiences can significantly affect a young person’s mental health and wellbeing.17,18,19 There are a number of online resources which help families and communities create safer on-line environments including the National Centre Against Bullying website and the eSafety Commissioner website.
Young people are also vulnerable to abuse when organisations neglect their responsibilities to foster a child-safe environment. This can be through failing to listen to children and young people or due to a lack of policies and procedures aimed at reducing risk of harm and prioritising the reputation of the organisation over the wellbeing of children and young people.
Organisations that interact with young people, either as part of their normal operations or on an ad-hoc basis, need to engage in child safe work practices. The Commissioner for Children and Young People WA publishes the National Principles for Child Safe Organisations WA: Guidelines and other child safe resources to assist organisations to identify and manage risks that affect the safety and wellbeing of children and young people.
Studies have repeatedly shown that when young people have no confidence that adults or institutions will respond to their safety concerns, they are less likely to raise concerns or seek help.20 Child safe and friendly organisations establish mechanisms for listening to children and young people about all types of concerns or complaints. A child-friendly complaint system must provide children and young people with a variety of safe ways to share concerns; respond appropriately to any complaints, disclosures or suspicions of harm; and review all complaints from children and achieve systemic improvements.
For more information on developing a child-friendly complaints system refer to the Commissioner for Children and Young People’s Complaints resources page.
Data gaps
There is limited qualitative data on WA young people’s experiences of their communities including whether they feel safe and welcome. It is important to gather young people’s perspectives of their communities and what makes them feel safe. Young people’s perceptions of safety are important and influence their behaviours, attitudes and mental health.
There is limited data on the prevalence of WA young people’s experiences of violence and abuse in their communities.
The Royal Commission into Institutional Responses to Child Sexual Abuse highlighted a lack of comprehensive data on abuse of children and young people and recommended that the Australian Government conduct and publish a nationally representative prevalence study on a regular basis to establish the extent of child maltreatment in institutional and non-institutional contexts in Australia (Recommendation 2.1).21 It is expected that this gap will be at least partially addressed by the Australian Child Maltreatment Study funded by the National Health and Medical Research Council.
Endnotes
- Commissioner for Children and Young People WA 2019, Discussion Paper: Living Environment - The effects of physical and social environments on the health and wellbeing of children and young people, Commissioner for Children and Young People WA.
- UNICEF 2019, United Nations Convention on the Rights of the Child, UNICEF [website].
- Guerra NG and Dierkhising MA 2011, The Effects of Community Violence on Child Development, Encyclopedia on Early Childhood Development.
- Luthar S and Goldstein A 2015, Children’s Exposure to Community Violence: Implications for Understanding Risk and Resilience, Journal of Clinical Child Adolescent Psychology, Vol 33, No 3.
- Kersten L et al 2017, Community Violence Exposure and Conduct Problems in Children and Adolescents with Conduct Disorder and Healthy Controls, frontiers in Behavioural Neuroscience, Vol 11.
- Little M et al 2015, Bringing Everything I Am Into One Place, Dartington Social Research Unit and Lankelly Chase.
- Webster C and Kingston S 2014, Crime and Poverty, in Reducing Poverty in the UK: A collection of evidence review, Joseph Rowntree Foundation, p. 148.
- Schwartz M 2010, Building communities, not prisons: Justice reinvestment and Indigenous over-imprisonment, Australian Indigenous Law Review, Vol 14, No 1.
- American Psychological Association 2019, Fact sheet: violence and socioeconomic status, American Psychological Association.
- Webster C and Kingston S 2014, Crime and Poverty, in Reducing Poverty in the UK: A collection of evidence review, Joseph Rowntree Foundation, p. 149.
- Schwartz M 2010, Building communities, not prisons: Justice reinvestment and Indigenous over-imprisonment, Australian Indigenous Law Review, Vol 14, No 1.
- Walsh, Tamara 2018, Keeping vulnerable offenders out of the courts: lessons from the United Kingdom, Criminal Law Journal, Vol 42, No 3.
- Bellefontaine T and Wisener R 2011, The evaluation of place-based approaches: Questions for further research, Policy Horizons Canada, p 6.
- Schwartz M 2010, Building communities, not prisons: Justice reinvestment and Indigenous over-imprisonment, Australian Indigenous Law Review, Vol 14, No 1.
- Webster K et al 2018, Australians’ attitudes to violence against women and gender equality. Findings from the 2017 National Community Attitudes towards Violence against Women Survey (NCAS), Australia’s National Research Organisation for Women’s Safety (ANROWS) Research report, 03/2018), ANROWS, p. 50.
- Ibid, p. 50.
- Tandoc E et al 2015, Facebook use, envy, and depression among college students: Is facebooking depressing?, Science Direct, Vol 43 p 139-146.
- Wu Y et al 2016, A Systematic Review of Recent Research on Adolescent Social Connectedness and Mental Health with Internet Technology Use, Adolescent Research Review, Vol 1, No 2.
- Child Family Community Australia 2012, Parental involvement in preventing and responding to cyberbullying, Australian Institute of Family Studies, Australian Government.
- Moore T et al 2016, Our safety counts: Children and young people’s perceptions of safety and institutional responses to their safety concerns, Institute of Child Protection Studies, Australian Catholic University, p. 7.
- Royal Commission into Institutional Responses to Child Sexual Abuse 2017, Final Report: Preface and executive summary, Australian Government, p. 106.
For more information on the importance of young people feeling and being safe in their community refer to the following resources:
- Bessell S and Mason J 2014, Putting the pieces in place: Children, communities and social capital in Australia, Australian National University and University of Western Sydney.
- Child Family Community Australia and NAPCAN 2016, Stronger Communities, Safer Children: Findings from recent Australian research on the importance of community in keeping children safe, Australian Institute of Family Studies.
- Commissioner for Children and Young People WA 2019, Discussion Paper: Living Environment - The effects of physical and social environments on the health and wellbeing of children and young people, Commissioner for Children and Young People WA.
- Politoff V et al 2019, Young Australians’ attitudes to violence against women and gender equality: Findings from the 2017 National Community Attitudes towards Violence against Women Survey (NCAS), Australian National Research Organisation for Women’s Safety (ANROWS) Insights, Issue 01/2019, ANROWS.
- Robinson S 2016, Feeling safe, being safe: what is important to children and young people with disability and high support needs about safety in institutional settings?, Centre for Children and Young People, Southern Cross University.
Endnotes
- Tucci J et al 2008, Children’s sense of safety: Children’s experiences of childhood in contemporary Australia, Australian Childhood Foundation, p. 11.
- Eastman C et al 2014, Thriving in Adversity: A positive deviance study of safe communities for children (SPRC Report 30/2014), Social Policy Research Centre, UNSW Australia.
- Guerra NG and Dierkhising MA 2011, The Effects of Community Violence on Child Development, Encyclopedia on Early Childhood Development.
- Luthar S and Goldstein A 2015, Children’s Exposure to Community Violence: Implications for Understanding Risk and Resilience, Journal of Clinical Child Adolescent Psychology, Vol 33, No 3.