


Transition from school

The transition from compulsory and structured schooling into either less structured education or employment requires young people to have developed the ability to work independently and with a commitment and enthusiasm for their chosen path. A sense of optimism and opportunity is important for young people to manage this transition successfully.
Last updated June 2020
Some data is available on WA high school students’ transition from high school.
Overview
Increasingly, the future of work for young people is recognised as requiring an array of portable skills and capabilities across diverse careers.1,2
In WA, students are required to remain at school or participate in an approved non-school option (such as employment or training) until the end of the year they turn 17 years and six months, or graduate from high school. Young people who remain engaged in education, training or employment following their compulsory school years have better long term prospects in the labour market, and consequently in life.3
According to findings from the Speaking Out Survey 2019, 60.3 per cent of WA Year 10 to Year 12 students would like to complete a university degree, 12.1 per cent aim for a TAFE certificate and 5.6 per cent would like a trade qualification.
Areas of concern
According to findings from the Speaking Out Survey 2019, a significantly lower proportion of female than male Year 7 to Year 12 students rates their life as the best possible (53.5% compared to 71.2%). Furthermore, 17.3 per cent of female Year 7 to Year 12 students rates their life as worst possible.
In the 2019 Mission Australia Youth Survey, a much lower proportion of female than male young people aged 15 to 19 years from WA felt positive about the future (51.5% of female young people compared to 61.8% of male young people).
One-third (34.5%) of Year 7 to 12 Aboriginal students report that Year 12 is the highest level of education they want to complete, compared to 11.1 per cent of non-Aboriginal students.
There is limited robust data reporting on whether WA young people feel ready for the transition from high school and how they experience that transition.
Endnotes
- Foundation for Young Australians 2017, The New Work Smarts: Thriving in the New Work Order, Foundation for Young Australians.
- Torii K and O’Connell M 2017, Preparing young people for the future of work. Policy Roundtable Report, Mitchell Report No 01/2017, Mitchell Institute.
- Ryan C 2011, Longitudinal Surveys of Australian Youth, Research Report 56: Year 12 completion and youth transitions, National Centre for Vocational Education Research (NCVER), p. 8.
Last updated June 2020
Optimism reflects the extent to which young people hold generally favourable expectations regarding their future. Higher levels of optimism have been linked to better subjective wellbeing, more persistence and resilience and coping mechanisms, and also better physical health.1 During adolescence, higher optimism has been linked to lower rates of depression and anxiety, stronger academic achievement and greater peer acceptance.2
Limited information exists about WA young people’s level of optimism for their future, particularly for young people between 15 and 17 years of age.
The Commissioner’s Speaking Out Survey 2019 asked students to rate their life satisfaction on a scale from 0 to 10 where (0) was the worst possible and (10) the best possible life for them. While this is not a direct measure of optimism about the future, it does reflect how WA young people feel about their life currently and can indicate their level of optimism.
Average ratings were higher for students in Years 4 to 6 than in Years 7 to 9 and 10 to 12 (7.8 in Years 4 to 6 compared to 7.1 in Years 7 to 9 and 6.5 in Years 10 to 12).3
With respect to grouped ratings (0 to 4, worst; 5 or 6; and 7 to 10, best), less than two-thirds (62.3%) of Year 7 to Year 12 students rated their life as the best possible and 14.3 per cent of high school students rated their life as worst possible.
|
Male |
Female |
Metropolitan |
Regional |
Remote |
Total |
|
|
7 to 10 |
71.2 |
53.5 |
61.3 |
65.0 |
70.4 |
62.3 |
|
5 to 6 |
17.8 |
29.2 |
24.0 |
22.2 |
16.9 |
23.4 |
|
0 to 4 |
11.1 |
17.3 |
14.7 |
12.8 |
12.7 |
14.3 |
Source: Commissioner for Children and Young People WA, Speaking Out Survey 2019 Data Tables [unpublished]
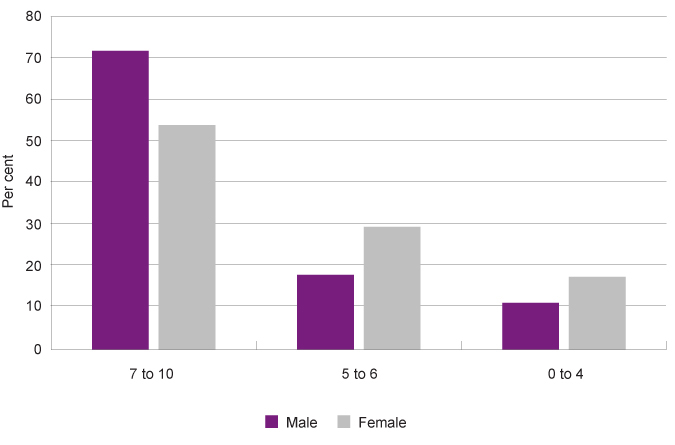
A significantly lower proportion of female than male Year 7 to Year 12 students rated their life as the best possible (53.5% compared to 71.2%). Furthermore, 17.3 per cent of female Year 7 to Year 12 students rated their life as the worst possible.
Proportion of Year 7 to Year 12 students rating their life satisfaction on a scale of '0' to '10', grouped responses by gender, per cent, WA, 2019
Source: Commissioner for Children and Young People WA 2020, Speaking Out Survey 2019 Data Tables [unpublished]
This result highlights a significant wellbeing gap between female and male high school students that is evident across multiple indicators. For more information refer to the Positive outlook on life measure in the Mental health indicator for the 12 to 17 years age group.
The differences for Year 7 to Year 12 students in different geographic locations and Aboriginal and non-Aboriginal students were not statistically significant.
Mission Australia Youth Survey
In the annual Mission Australia 2019 Youth Survey, 25,126 young people across Australia aged 15 to 19 years responded to questions across a broad range of topics including education and employment, influences on post-school goals, housing and homelessness, participation in community activities, general wellbeing, values and concerns, preferred sources of support, as well as feelings about the future.
In total, 2,766 young people from WA aged 15 to 19 years responded to Mission Australia’s Youth Survey 2019.4 Mission Australia recommend caution when interpreting and generalising the results for certain states or territories because of the small sample sizes and the imbalance between the number of young females and males participating in the survey.
More than one-half of WA respondents (50.3%) were male and 45.8 per cent were female. A total of 158 (5.9%) respondents from WA identified as Aboriginal and/or Torres Strait Islander.5
In the 2019 survey, young people were asked how positive they felt about the future. In 2019, WA young people were slightly less positive than in 2018 (56.2% very positive or positive in 2019 compared to 57.4% in 2018) and less positive than Australian young people overall (WA: 56.2%, Australia: 58.3%).
Last updated June 2020
Aspirations are future-oriented, driven by conscious and unconscious motivations and indicate a person’s commitments towards a particular goal.1 In general, young people with higher aspirations have better outcomes than young people with lower aspirations.2
In the Commissioner’s Speaking Out Survey 2019, students in Year 7 to Year 12 were asked the highest level of education they would like to finish.
According to findings from the Speaking Out Survey 2019, 60.3 per cent of WA Year 10 to Year 12 students hope to complete a university degree. A little more than 10 per cent would like to complete a TAFE certificate (12.1%) and 5.6 per cent a trade qualification (apprenticeship). Another 10 per cent (10.8%) would like to finish Year 12 and, while almost nine per cent of Year 10 to 12 students said they do not know what level of education they would like to finish.
|
Years 10 to 12 |
|
|
Year 10 or 11 |
1.3 |
|
Year 12 |
10.8 |
|
Trade qualification |
5.6 |
|
TAFE certificate or similar |
12.1 |
|
University |
60.3 |
|
Other |
1.5 |
|
I don’t know |
8.5 |
Source: Commissioner for Children and Young People WA, Speaking Out Survey 2019 Data Tables [unpublished]
The data for Year 10 to 12 students cannot be disaggregated by gender, region or Aboriginal status, however, results for all high school students (Year 7 to Year 12) show that almost one-third of students in remote areas are not aiming to complete any further education beyond Year 12 (29.8% of remote Year 7 to Year 12 students would like to complete Year 12 as their highest level of education). This is significantly different from regional and metropolitan students (regional: 11.1%, metropolitan: 11.5%).
These findings are consistent with the 2019 National Regional, Rural and Remote Tertiary Education Strategy which reported that young people in remote areas have less access, opportunity and support to continue with their education after Year 12.3
|
Male |
Female |
Metropolitan |
Regional |
Remote |
All |
|
|
Year 10 or 11 |
5.0 |
3.2 |
3.4 |
7.9 |
5.5 |
4.1 |
|
Year 12 |
12.5 |
12.3 |
11.5 |
11.1 |
29.8 |
12.4 |
|
Trade qualification |
8.2 |
1.7 |
4.0 |
8.1 |
11.5 |
5.0 |
|
TAFE certificate or similar |
9.0 |
8.7 |
9.1 |
8.2 |
7.9 |
8.9 |
|
University |
53.6 |
62.7 |
60.0 |
53.7 |
34.7 |
57.8 |
|
Other |
1.5 |
0.9 |
1.3 |
N/A |
N/A |
1.2 |
|
I don’t know |
10.3 |
10.5 |
10.6 |
10.1 |
10.1 |
10.5 |
Source: Commissioner for Children and Young People, Speaking Out Survey 2019 Data Tables [unpublished]
N/A – Cells are suppressed where the number of students providing data for that response was less than 5.
Aboriginal Year 7 to Year 12 students are significantly less likely than non-Aboriginal students to want to complete a university degree (29.3% compared to 59.4%).
|
Aboriginal |
Non-Aboriginal |
|
|
Year 10 or 11 |
7.5 |
4.0 |
|
Year 12 |
34.5 |
11.1 |
|
Trade qualification |
6.9 |
4.9 |
|
TAFE certificate or similar |
9.5 |
8.9 |
|
University |
29.3 |
59.4 |
|
Other |
1.3 |
1.2 |
|
I don’t know |
11.0 |
10.5 |
Source: Commissioner for Children and Young People, Speaking Out Survey 2019 Data Tables [unpublished]
Importantly, one-third (34.5%) of Aboriginal high school students report that Year 12 is the highest level of education they want to complete and less than one-third (29.3%) aspire to complete a university degree.
Mission Australia Youth Survey
In the annual Mission Australia 2019 Youth Survey,4 25,126 young people across Australia aged 15 to 19 years responded to questions across a broad range of topics including education and employment, influences on post-school goals, housing and homelessness, participation in community activities, general wellbeing, values and concerns, preferred sources of support, as well as feelings about the future.
The survey asks young people aged 15 to 19 years who are still at school, what they are planning to do after leaving school. In the 2019 survey, 61.4 per cent of WA respondents planned to go to university after school compared to 64.8 per cent of respondents nationally. WA respondents were more likely to report planning to go to TAFE or a private college than Australian respondents generally (WA: 15.8%, Australia: 11.7%).
|
Australia |
WA |
WA |
|||
|
Years |
2019 |
2016 |
2017 |
2018 |
2019 |
|
Attending university |
64.8 |
57.8 |
63.9 |
59.2 |
61.4 |
|
Getting a job |
33.6 |
34.9 |
32.6 |
35.0 |
30.9 |
|
Travelling or gap year |
28.0 |
29.1 |
22.7 |
29.0 |
25.9 |
|
Attend TAFE or college |
11.7 |
21.3 |
19.4 |
21.8 |
15.8 |
|
Undertake an apprenticeship |
11.3 |
12.4 |
9.1 |
9.1 |
11.3 |
Source: Mission Australia, Youth Survey Report 2016 to 2019
Note: Respondents were able to choose more than one option. Items are listed in order of WA frequency.
The proportion of WA respondents reporting they would get a job or attend TAFE after school has decreased since 2016.
While going to university was the most frequently chosen option among both female and male respondents from WA, in 2019 a higher proportion of female than male students stated that they planned to do so (64.8% compared with 59.4%). A greater proportion of female respondents also reported plans to get a job (33.7% compared to 28.9%), travel or go on a gap year after school (33.3% compared to 18.7%) or to go to TAFE or college (18.3% compared to 13.1%).
|
Male |
Female |
|
|
Attending university |
59.4 |
64.8 |
|
Getting a job |
28.9 |
33.7 |
|
Travelling or gap year |
18.7 |
33.3 |
|
Attend TAFE or college |
13.1 |
18.3 |
|
Undertake an apprenticeship |
16.7 |
5.5 |
Source: Mission Australia, Youth Survey Report 2019
Note: Respondents were able to choose more than one option. Items are listed in order of WA frequency.
Endnotes
- Hart CS 2016, How Do Aspirations Matter?, Journal of Human Development and Capabilities, Vol 17, No 3.
- Gutman LM and Akerman R 2008, Determinants of Aspirations: Research report No 27, Centre for Research on the wider benefits of learning, Institute of Education, p. ii.
- Commonwealth of Australia 2019, National Regional, Rural and Remote Tertiary Education Strategy, Australian Government, p. 34.
- In total, 2,766 young people from WA aged 15 to 19 years responded to Mission Australia’s Youth Survey 2019. Mission Australia recommend caution when interpreting and generalising the results for certain states or territories because of the small sample sizes and the imbalance between the number of young females and males participating in the survey. More than one-half of WA respondents (50.3%) were male and 45.8 per cent were female. A total of 158 (5.9%) respondents from WA identified as Aboriginal and/or Torres Strait Islander.
Last updated June 2020
Limited information exists about the views of WA high school students regarding their transition from high school into further education, employment or other activities.
The transition from high school to further education or paid work is a critical stage for young people as they move into the adult world. Young people who understand the options available to them after formal schooling and feel prepared for these next steps are more likely to have better educational and employment outcomes and also have better wellbeing outcomes.
There is limited robust data reporting on how WA young people feel about their future and their transition from school.
Post School Intentions and Student Satisfaction Survey
The WA Department of Education conducts the annual Post School Intentions and Student Satisfaction Survey of Year 12 students in government schools. In 2017, 8,504 of 14,032 Year 12 students (semester 2) completed the survey which represents a response rate of 60.6 per cent.1 The response rate for Aboriginal students was 40.7 per cent with only 292 of 718 students completing the survey.
In the survey, students were asked: Overall, how satisfied are you with the way the school has prepared you for your career goals? While 71.5 per cent of respondents were either satisfied or very satisfied, a significant proportion of students (28.5%) were dissatisfied or very dissatisfied. More female Year 12 students were dissatisfied (30.1%) than male Year 12 students (26.9%). Aboriginal students were more likely to be satisfied than non-Aboriginal students, however, due to the low response rate for Aboriginal students, this result ought to be interpreted with caution.
|
All |
Female |
Male |
Aboriginal |
|
|
Very satisfied |
11.7 |
11.0 |
12.4 |
10.8 |
|
Satisfied |
59.8 |
58.9 |
60.8 |
64.9 |
|
Dissatisfied |
22.6 |
24.5 |
20.7 |
21.9 |
|
Very dissatisfied |
5.9 |
5.6 |
6.2 |
2.4 |
Source: WA Department of Education, custom report on Post School Intentions and Student Satisfaction Survey prepared for Commissioner for Children and Young People WA [unpublished]
|
Metropolitan |
Inner regional |
Outer regional |
Remote |
Very remote* |
|
|
Very satisfied |
11.5 |
15.9 |
9.7 |
10.4 |
16.0 |
|
Satisfied |
59.4 |
60.1 |
64.6 |
57.0 |
57.3 |
|
Dissatisfied |
23.0 |
20.0 |
20.9 |
24.3 |
25.3 |
|
Very dissatisfied |
6.1 |
4.0 |
4.8 |
8.4 |
1.3 |
Source: WA Department of Education, custom report on Post School Intentions and Student Satisfaction Survey prepared for Commissioner for Children and Young People WA [unpublished]
* The number of respondents in category ‘very remote’ is <100, consequently results ought to be interpreted with caution.
Mission Australia Youth Survey
In the annual Mission Australia 2019 Youth Survey,2 25,126 young people across Australia aged 15 to 19 years responded to questions across a broad range of topics including education and employment, influences on post-school goals, housing and homelessness, participation in community activities, general wellbeing, values and concerns, preferred sources of support, as well as feelings about the future.
In the survey, respondents were asked how confident they were in their ability to achieve their study/work goals after school.
|
2018 |
2019 |
|
|
Extremely confident |
9.7 |
10.7 |
|
Very confident |
34.3 |
38.5 |
|
Somewhat confident |
43.6 |
39.9 |
|
Slightly confident |
8.9 |
8.5 |
|
Not at all confident |
3.6 |
2.5 |
Source: Mission Australia, Youth Survey Report 2018 and 2019
In 2019, a higher proportion of WA young people were extremely or very confident of achieving their study/work goals than in 2018 (49.2% compared to 44.0%).
Notably, in 2019 less than one-half (41.4%) of WA female respondents were extremely or very confident of achieving their study/work goals (56.1% of WA male respondents).3
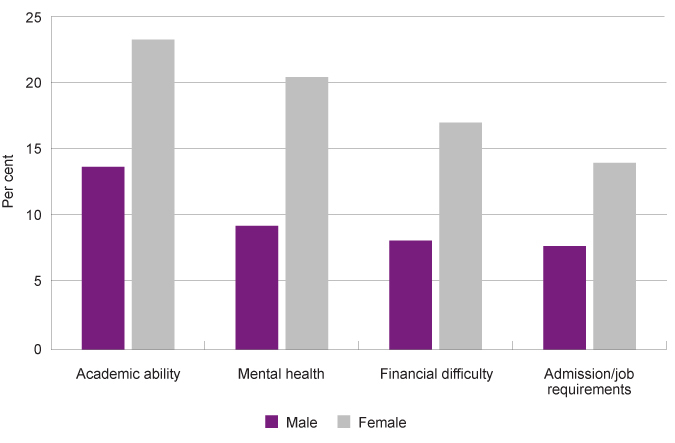
Respondents were also asked whether they felt there were any barriers that may impact the achievement of their study/work goals after finishing school. The barriers most commonly cited by WA participants were academic ability (18.0%), mental health (14.6%), financial difficulty (12.4%) and admission/job requirements (10.6%).4 These barriers were in line with national responses.
Higher proportions of WA female young people reported that any of these barriers may impact on the achievement of their work/study goals compared to male young people.
|
Male |
Female |
|
|
Academic ability |
13.6 |
23.1 |
|
Mental health |
9.2 |
20.3 |
|
Financial difficulty |
8.1 |
16.9 |
|
Admission/job requirements |
7.7 |
13.9 |
Source: Mission Australia, Youth Survey Report 2019
Proportion of young people aged 15 to 19 years reporting barriers to their work/study goals by gender, per cent, WA, 2019
Source: Mission Australia, Youth Survey Report 2019
These results are consistent with the Speaking Out Survey 2019 which found a significant wellbeing gap between female and male high school students across multiple indicators including lower self-esteem and higher levels of stress experienced by female young people. Further in-depth analysis and exploration of these results will be carried out in 2020 to better understand the factors influencing these differences in wellbeing.
Endnotes
- WA Department of Education, custom report on Post School Intentions and Student Satisfaction Survey prepared for Commissioner for Children and Young People WA.
- In total, 2,766 young people from WA aged 15 to 19 years responded to Mission Australia’s Youth Survey 2019. Mission Australia recommend caution when interpreting and generalising the results for certain states or territories because of the small sample sizes and the imbalance between the number of young females and males participating in the survey. More than one-half of WA respondents (50.3%) were male and 45.8 per cent were female. A total of 158 (5.9%) respondents from WA identified as Aboriginal and/or Torres Strait Islander.
- Carlisle E et al. 2019, Youth Survey Report 2019, Mission Australia.
- Ibid.
Last updated June 2020
While many young Western Australians have higher educational qualifications than previous generations, they face many challenges finding paid employment once they have completed their studies. Some of the key barriers cited by employers about young people applying for work are lack of ‘employability skills’ or work experience.1 It can, therefore, be beneficial for students to gain some work experience through part-time work while still at school.
However, there are conflicting views on whether working part-time while still in high school is beneficial over the longer term. Australian research using data from the Longitudinal Surveys of Australian Youth found that the effects of combining school and work of more than ten hours a week had a moderately negative effect on school and post-school study outcomes, but a positive effect on post-school employment outcomes. The negative effects were nevertheless limited overall and were stronger for those who work during Year 10 compared to Year 11 and Year 12.2
The Commissioner’s Speaking Out Survey 2019 found that one-quarter (25.8%) of Year 7 to Year 12 students have a regular paid part-time job. Further, 10.2 per cent of high school students have worked for money during school holidays and another 9.8 per cent have worked sometime during school term but not regularly.
|
Male |
Female |
Metropolitan |
Regional |
Remote |
Total |
|
|
Yes, a regular part-time job (eg paper run or café work) |
24.9 |
26.6 |
24.4 |
33.4 |
26.0 |
25.8 |
|
Yes, I worked during the school holidays |
11.8 |
8.6 |
9.0 |
14.0 |
18.3 |
10.2 |
|
Yes, I sometimes worked during the school term |
10.5 |
9.2 |
9.7 |
7.9 |
17.8 |
9.8 |
|
No, I didn’t work for pay in the last year |
56.6 |
58.8 |
60.0 |
49.2 |
45.4 |
57.7 |
Source: Commissioner for Children and Young People, Speaking Out Survey 2019 Data Tables [unpublished]
Note: Respondents were able to choose as many options as they needed.
A higher proportion of regional and remote students have worked for pay in the last year than metropolitan students (metropolitan: 40.0%, regional: 50.8%, remote: 54.6%).
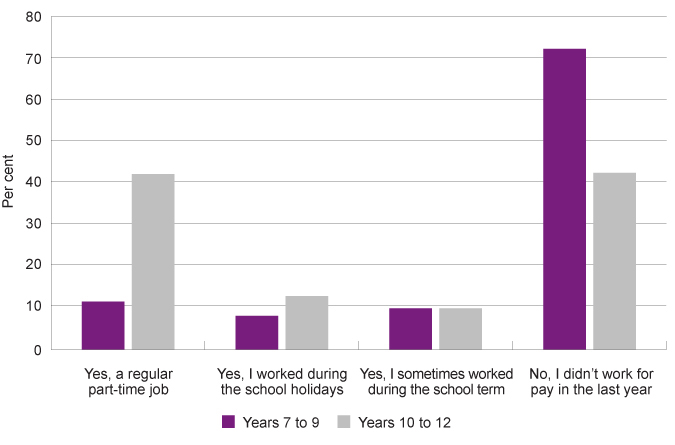
The majority (57.9%) of students in Years 10 to 12 have worked for money in the past 12 months. Furthermore, students in Year 10 to Year 12 are significantly more likely than students in Years 7 to 9 to report having a regular part-time job (41.8% compared to 11.4%).
|
Years 7 to 9 |
Years 10 to 12 |
|
|
Yes, a regular part-time job (eg paper run or café work) |
11.4 |
41.8 |
|
Yes, I worked during the school holidays |
8.0 |
12.7 |
|
Yes, I sometimes worked during the school term |
9.8 |
9.8 |
|
No, I didn’t work for pay in the last year |
71.7 |
42.1 |
Source: Commissioner for Children and Young People, Speaking Out Survey 2019 Data Tables [unpublished]
Note: Respondents were able to choose as many options as they needed.
Proportion of Year 7 to 12 students reporting they have worked for money in the last year or they have not by year level, per cent, WA, 2019
Source: Commissioner for Children and Young People, Speaking Out Survey 2019 Data Tables [unpublished]
Note: Respondents were able to choose as many options as they needed.
Aboriginal students are less likely than non-Aboriginal students to have a regular part-time job (19.1% compared to 26.1%) and more likely to work sometimes or during school holidays (28.1% compared to 19.5%).3
Students in the Speaking Out Survey 2019 were also asked to give the main reason they worked for money or had a paid job. The majority of Year 10 to Year 12 students (67.0%) reported the main reason they worked was that they wanted to: ‘have money of my own to spend on things I want’. More than one-in-ten (12.6%) students said they worked for money to ‘get skills and experience’.
|
Years 10 to 12 |
|
|
To have money of my own to spend on things I want |
67.0 |
|
To get skills and experience |
12.6 |
|
Because my parents (or the people who look after me) wanted me to |
6.0 |
|
To save for study |
4.4 |
|
Other reasons |
4.1 |
|
To see if I liked doing that kind of work |
2.5 |
|
To get money for my family |
2.3 |
|
To have fun, be with my friends |
1.0 |
Source: Commissioner for Children and Young People, Speaking Out Survey 2019 Data Tables [unpublished]
The Australian Bureau of Statistics (ABS) monthly Labour Force report for February 2020 showed that 31.2 per cent of WA 15 to 19 year-olds were working part-time while attending school.4 This is consistent with the Mission Australia Youth Survey 2019, in which 35.2 per cent of WA respondents reported they were working part-time.5
April 2020 data from the ABS highlights that the COVID-19 pandemic will disproportionately impact young people with many losing their jobs and experiencing a reduction in their hours and wages.6 Further analysis of the impact of COVID-19 on young people’s transition from school will be conducted in the future.
Endnotes
- Department of Jobs and Small Business 2018, Improving the employment prospects of young people: A resource for career practitioners, Labour Market Research and Analysis Branch Department of Jobs and Small Business.
- Anlezark A and Lim P 2011, Longitudinal Surveys of Australian Youth: Does combining school and work affect school and post-school outcomes, Adelaide, National Centre for Vocational Education Research, Commonwealth of Australia.
- Commissioner for Children and Young People WA 2020, Speaking Out Survey 2019 Data Tables Commissioner for Children and Young People WA.
- Australian Bureau of Statistics 2018, 6202: Labour Force Survey, Table 16 – May 2018.
- Carlisle E et al 2019, Youth Survey Report 2019, Mission Australia, p. 197.
- Australian Bureau of Statistics 2020, 6160.0.55.001 - Weekly Payroll Jobs and Wages in Australia, Week ending 4 April 2020, ABS.
Last updated June 2020
At 30 June 2019, there were 2,420 WA young people in care aged between 10 and 17 years, more than one-half of whom (53.3%) were Aboriginal.1
International research consistently shows that young people leaving care are vulnerable to a range of negative outcomes, including unemployment, housing instability and involvement with the criminal justice system.2
In WA, young people in care are deemed independent and no longer under the care of the Chief Executive Officer of the Department of Communities once they turn 18 years of age. These young people are entitled to some additional assistance up to 25 years of age.3
In 2018 the WA Auditor General released a report on Young People Leaving Care. The Auditor General found that in 82 per cent of cases, planning for a young person to leave care did not commence at 15 years of age, as required by the Department’s policy.4 Further, the review showed that critical needs such as housing, education, employment and contingency plans were not always included and that the majority of reviewed cases did not contain a clear plan for the young person’s immediate future.5
More robust information and data is required that reflects the experiences, views and aspirations of 15 to 17 year-old young people in care in WA who are approaching the transition from school and to independence.
Endnotes
- Department of Communities 2019, Annual Report: 2018–19, WA Government p. 26.
- McDowall JJ 2009, CREATE Report Card 2009 - Transitioning from care: Tracking progress, CREATE Foundation, Sydney, p. 9.
- Department of Communities (previously, Child Protection and Community Support) 2015, Leaving Care Policy, Government of Western Australia.
- Office of the Auditor General 2018, Young People Leaving Care: report 2, August 2018–19, Office of the Auditor General Western Australia, p. 7.
- Ibid, p. 7-8
Last updated June 2020
The Australian Bureau of Statistics Disability, Ageing and Carers, 2018 data collection reports that approximately 30,200 WA children and young people (9.2%) aged five to 14 years have reported disability.1,2
People with disability, including children and young people, often experience social exclusion and barriers to meaningful participation in the community.3 In 2011, PWC reported that people with disability were 50.0 per cent less likely to be employed than people without disability, and had a significantly higher likelihood of poverty.4
The transition from school into either more study or paid work is a critical time for young people with disability in WA, yet there is limited data on how they experience this transition or their post-school outcomes.
For data on the adjustments that schools implement to support access and participation in learning for students with disability refer to the School attendance indicator.
Speaking Out Survey 2019
In 2019, the Commissioner for Children and Young People (the Commissioner) conducted the Speaking Out Survey which sought the views of a broadly representative sample of Year 4 to Year 12 students in WA on factors influencing their wellbeing.5 This survey was conducted across mainstream schools in WA; special schools for students with disability were not included in the sample.
In this survey, Year 7 to Year 12 students were asked: Do you have any long-term disability (lasting 6 months or more) (e.g. sensory impaired hearing, visual impairment, in a wheelchair, learning difficulties)? In total, 315 (11.4%) participating Year 7 to Year 12 students answered yes to this question.
Due to the relatively small sample size, the following results for students who reported long-term disability are observational and not representative of the full population of students with disability in Years 7 to 12 in WA. Comparisons between participating students with and without disability are therefore observational and not statistically significant. Nevertheless, these results provide an indication of the views and experiences of young people with disability.
A measure of how well a young person will manage the transition from school is their level of optimism. Optimism reflects the extent to which young people hold generally favourable expectations regarding their future. Higher levels of optimism have been linked to better subjective wellbeing, more persistence and resilience and coping mechanisms, and also better physical health.6
In the 2019 Speaking Out Survey students were asked to rate their life satisfaction on a scale from 0 to 10 where (0) was the worst possible and (10) the best possible life for them. While this is not a direct measure of optimism about the future, it does reflect how WA young people feel about their life currently and can indicate their level of optimism.
Among Year 7 to Year 12 students with disability almost one-half (49.0%) reported they had the best possible life (7 to 10) and a further 30.0 per cent rated their life satisfaction between 5 and 6 on the scale.
|
Young people with disability |
Young people without disability |
|
|
7 to 10 |
49.0 |
66.0 |
|
5 to 6 |
30.0 |
22.2 |
|
0 to 4 |
21.1 |
11.8 |
Source: Commissioner for Children and Young People, Speaking Out Survey 2019 Data Tables [unpublished]
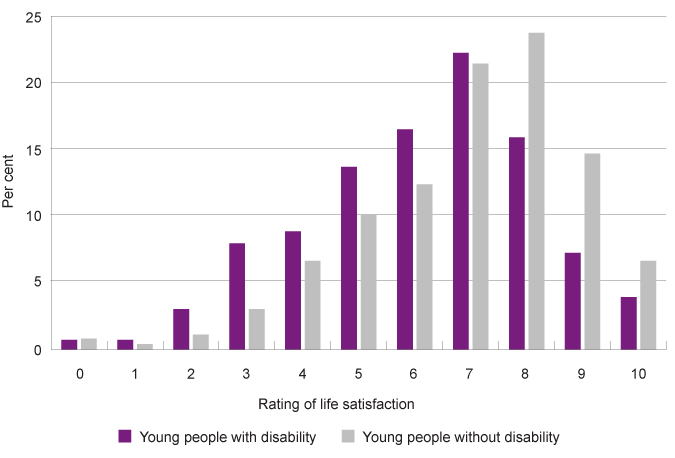
A substantial proportion (21.1%) of young people with disability reported a very low life satisfaction with a rating of between 0 and 4 (compared to 11.8% of young people without disability). Consequently, average ratings were higher for students without disability than those with disability (7.0 students without disability and 6.2 for students with disability).7
Proportion of Year 7 to Year 12 students rating their life satisfaction on a scale of '0' to '10' by disability status, per cent, WA, 2019
Source: Commissioner for Children and Young People, Speaking Out Survey 2019 Data Tables [unpublished]
While these results are not a direct measure of the prevalence of mental health issues, they support research findings that suggest that children and young people with disability are more likely to experience mental health problems than students without disability.8 Diminished life satisfaction and the associated likelihood of mental health concerns may adversely impact many life outcomes including school transitions. For more information refer to the Mental health indicator for the 12 to 17 years age group.
Aspirations are also important for young people to successfully transition from school. In general, young people with higher aspirations have better outcomes than young people with lower aspirations.9
In the Commissioner’s Speaking Out Survey 2019, students in Year 10 to Year 12 were asked the highest level of education they would like to finish. Young people who reported a disability had similar aspirations to those who did not report a disability.
The majority (62.1%) of Year 10 to Year 12 students with disability would like to complete a university degree (without disability: 62.5%).
|
Young people with disability |
Young people without disability |
|
|
Year 10 or 11 |
1.2 |
0.9 |
|
Year 12 |
10.7 |
11.3 |
|
Trade qualification |
5.2 |
4.6 |
|
TAFE certificate or similar |
11.3 |
11.0 |
|
University |
62.1 |
62.5 |
|
Other |
1.4 |
1.4 |
|
I don’t know |
8.0 |
8.4 |
Source: Commissioner for Children and Young People, Speaking Out Survey 2019 Data Tables [unpublished]
Some of the key barriers cited by employers with regard to young people applying for work are lack of ‘employability skills’ or work experience.10 Paid work while in high school can, therefore, be beneficial to gain experience and to develop employability skills, such as reliability, communication skills and teamwork. This can be particularly critical for young people with disability.11
The Commissioner’s Speaking Out Survey 2019 found that 22.7 per cent of Year 7 to Year 12 students with disability have a regular paid part-time job. This proportion is only slightly lower than the proportion of students without disability (26.7%).
Further, another 20.8 per cent of students with disability have worked for money during the school holidays or sometime during school term. More than one-half (60.9%) of students with disability in Years 7 to 12 have not worked for money in the past 12 months.
|
Young people with disability |
Young people without disability |
|
|
Yes, a regular part-time job |
22.7 |
26.7 |
|
Yes, I worked during the school holidays |
10.1 |
10.2 |
|
Yes, I sometime worked during the school term |
10.7 |
9.8 |
|
No, I didn’t work for pay in the last year |
60.9 |
56.6 |
Source: Commissioner for Children and Young People, Speaking Out Survey 2019 Data Tables [unpublished]
Limited information exists about the views of WA high school students with disability regarding their transition from high school into further education, employment or other activities.
Endnotes
- The ABS uses the following definition of disability: ‘In the context of health experience, the International Classification of Functioning, Disability and Health (ICFDH) defines disability as an umbrella term for impairments, activity limitations and participation restrictions… In this survey, a person has a disability if they report they have a limitation, restriction or impairment, which has lasted, or is likely to last, for at least six months and restricts everyday activities.’ Australian Bureau of Statistics 2016, Disability, Ageing and Carers, Australia, 2015, Glossary.
- Australian Bureau of Statistics 2020, Disability, Ageing and Carers, Australia, 2018: Western Australia, Table 1.1 Persons with disability, by age and sex, estimate, and Table 1.3 Persons with disability, by age and sex, proportion of persons.
- National People with Disabilities and Carer Council 2012, SHUT OUT: The Experience of People with Disabilities and their Families in Australia: National Disability Strategy Consultation Report, Commonwealth of Australia.
- PWC 2011, Disability expectations: Investing in a better life, a stronger Australia, PWC, p. 9.
- Commissioner for Children and Young People WA 2020, Speaking Out Survey: The views of WA children and young people on their wellbeing - a summary report, Commissioner for Children and Young People WA.
- Carver CS et al 2010, Optimism, Clinical Psychology Review, Vol 30 No 7.
- Commissioner for Children and Young People 2020, Speaking Out Survey 2019 Data Tables, [unpublished].
- Dix K et al 2013, KidsMatter and young children with disability: Evaluation Report, Flinders Research Centre for Student Wellbeing & Prevention of Violence, Shannon Research Press, p. xi.
- Gutman LM and Akerman R 2008, Determinants of Aspirations: Research report No 27, Centre for Research on the wider benefits of learning, Institute of Education, p. ii.
- Department of Jobs and Small Business 2018, Improving the employment prospects of young people: A resource for career practitioners, Labour Market Research and Analysis Branch Department of Jobs and Small Business.
- Wakeford M and Waugh F 2014, Transitions to employment of Australian young people with disability and the Ticket to Work initiative, National Ticket to Work Network, p. 22.
Last updated June 2020
The transition from high school into either further education or work is a critical period for young people. There are multiple pathways for young people to take during this period including further education at university, vocational education and training or employment, which could be via apprenticeships or traineeships.
In general, young people who complete Year 12 tend to have more successful transitions,1 which is why the apparent Year 10 to 12 retention rate is a key measure of wellbeing under the School attendance indicator. However, other pathways can provide young people with successful futures. For example, research has found that apprenticeships and traineeships can provide similar employment and economic outcomes to completion of Year 12.2
A critical factor is to keep young people engaged in either study or work through individualised pathways that meet their particular capabilities and interests. When young people are interested, optimistic and can see a future that they feel positive about, they will participate more fully and get better outcomes.
Access, opportunity and support for young people in regional and remote areas in WA are essential. There are fewer tertiary education options for young people in regional and remote areas.3 Furthermore, young people living in remote areas will often require additional support to transition to further education due to the distances involved and other challenges they experience,4 such as higher levels of poverty and social exclusion (refer to the Material basics indicator for the 12 to 17 age group).
There is limited data about WA young people’s feelings about their transition from school. The data that is available suggests that a significant number (28.5%) of WA Year 12 students in government schools do not feel that their school prepared them for their career goals. No additional data is publicly available on why this is the case. School governing bodies ought to explore these results further and consider policy and practices that will address students’ concerns in this regard.
Data gaps
Limited data exists on WA young people’s views on their transition from school into further study or employment. In particular, there is limited data on the experiences and views of Aboriginal young people and young people with disability.
Without data on this transition it is difficult to assess how the education system is meeting the needs of WA young people.
Endnotes
- Ryan C 2011, Longitudinal Surveys of Australian Youth, Research Report 56: Year 12 completion and youth transitions, National Centre for Vocational Education Research (NCVER), p. 8.
- Ibid.
- Commonwealth of Australia 2019, National Regional, Rural and Remote Tertiary Education Strategy, Commonwealth of Australia, p. 5.
- Ibid.
For more information on young people’s transition from school refer to the following resources:
- Anlezark A and Lim P 2011, Longitudinal Surveys of Australian Youth: Does combining school and work affect school and post-school outcomes, Adelaide, National Centre for Vocational Education Research, Commonwealth of Australia.
- Commonwealth of Australia 2019, National Regional, Rural and Remote Tertiary Education Strategy, Commonwealth of Australia.
- Dommers E et al 2017, Engaging young early school leavers in vocational training, National Centre for Vocational Education Research (NCVER).
- Foundation for Young Australians 2017, The New Work Smarts: Thriving in the New Work Order, Foundation for Young Australians.
- Lamb, S et al 2015, Educational opportunity in Australia 2015: Who succeeds and who misses out, Centre for International Research on Education Systems, Victoria University for the Mitchell Institute.
- Ryan C 2011, Longitudinal Surveys of Australian Youth, Research Report 56: Year 12 completion and youth transitions, National Centre for Vocational Education Research (NCVER).
- Torii K and O’Connell M 2017, Preparing young people for the future of work. Policy Roundtable Report. Mitchell Report No 01/2017, Mitchell Institute.
- Venn D 2018, Indigenous Youth Employment and School-to-Work Transition: 2016 Census Papers, Centre for Aboriginal Economic Policy Research, Australian National University.